Slide 4 of 4 from Free Data-Driven Charts for PowerPoint
FF0014-01-data-driven-charts-4
Candlestick Chart for Business Review Presentation
- Chart
- Candlestick Chart
- Evaluation Slide
- 16:9
- 100% Editable
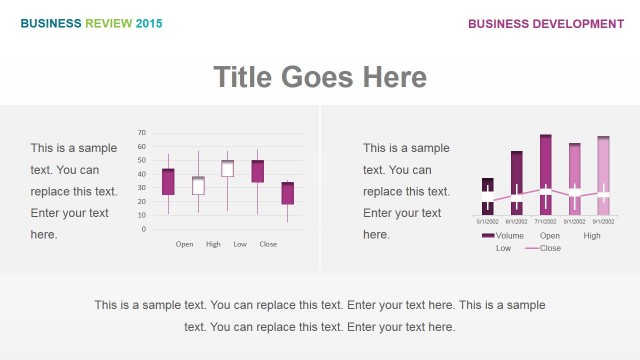
The Candlestick Chart Layout from the Free Data-Driven Charts for PowerPoint template offers a clear and editable slide design ideal for financial performance reviews and market analysis presentations. This slide template integrates vector icons and editable shapes to visualize Open, High, Low, and Close values effectively, supporting detailed investment summary reports within a business presentation or pitch deck template.
What’s on This Slide
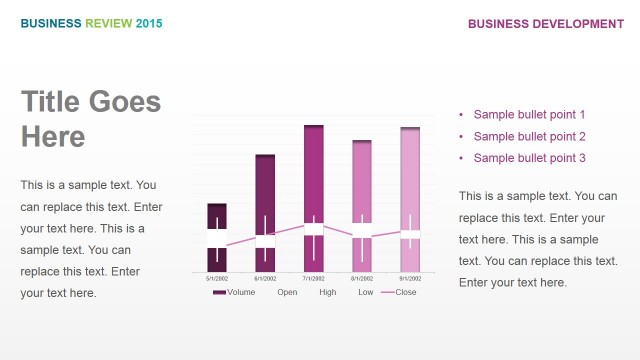
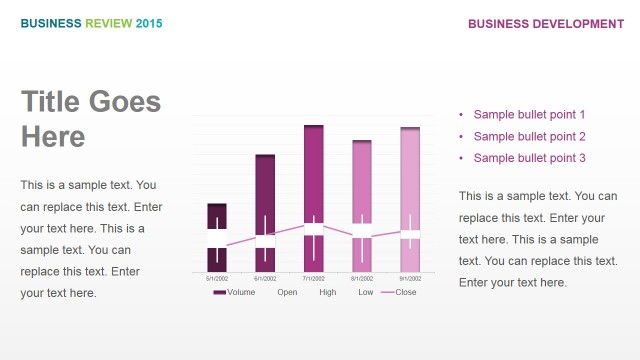
The layout features a candlestick chart positioned on the left, displaying four vertical bars representing Open, High, Low, and Close values. Each bar has a distinct color, with purple for the filled sections and white for the empty ones. On the right, there is a large title placeholder at the top, followed by three text placeholders stacked vertically. The text placeholders are aligned to the left and are visually separated from the chart. The background is light with a subtle gradient, enhancing the visual hierarchy of the elements.
How to Use It
This layout serves to present financial data in a candlestick format, ideal for business reviews or performance analysis. It fits well in a sequence after introductory slides, providing a detailed view of market trends. This structure is useful for analysts and managers discussing stock performance or financial metrics. It allows for clear data representation, making it suitable for quarterly reports or investment summaries.
Text Placeholders & Capacity
Keep your copy within these limits so it fits without resizing. Body slots can hold roughly 25-30 words each.
| Placeholder | Count | Max characters (approx.) |
|---|---|---|
| Slide title | 1 | 30 |
| Body paragraph | 3 | 150 |
| Item heading | 4 | 10 |
Slide Keywords
Download unlimited PowerPoint templates, charts and graphics for your presentations with our annual plan.
DOWNLOADReturn to Free Data-Driven Charts for PowerPoint.