Slide 3 of 4 from Free Data-Driven Charts for PowerPoint
FF0014-01-data-driven-charts-3
Multi-Series Line Chart for Business Review
- Chart
- Line Chart
- Evaluation Slide
- 16:9
- 100% Editable
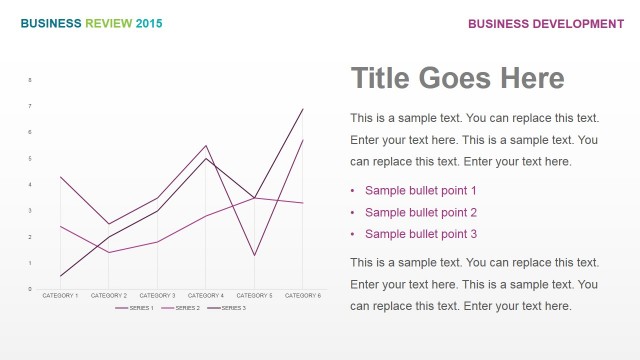
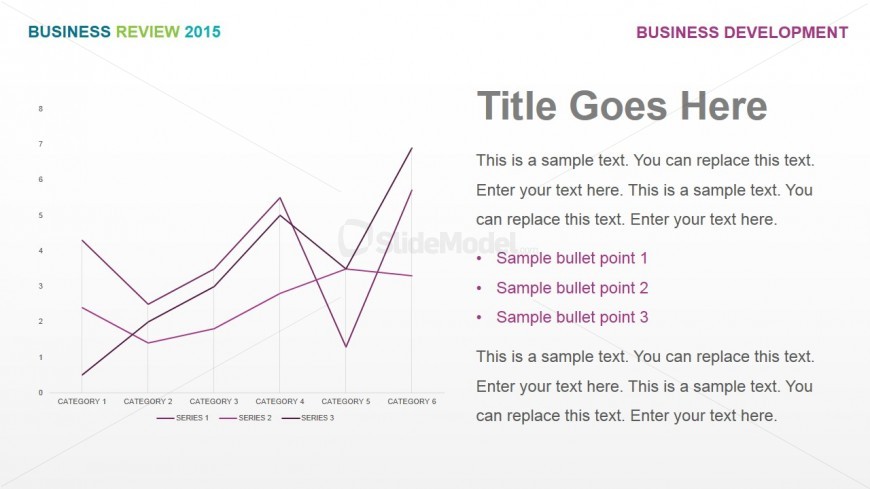
The Multi-Series Line Chart with Bullets slide from the Free Data-Driven Charts for PowerPoint template offers a clear layout for comparing multiple data trends. This slide template combines editable slides with vector icons and text placeholders, making it suitable for business presentations focused on performance review and trend analysis. Its organized design supports effective communication of complex data sets within a corporate presentation or pitch deck template.
What’s on This Slide
The slide features a multi-series line chart positioned on the left side, displaying three distinct series represented by different colored lines. The chart includes labeled axes with categories listed horizontally at the bottom and numerical values vertically on the left. To the right, there are text placeholders for a title at the top, followed by a body text area containing sample text and three bullet points. The overall layout is organized, with the chart and text clearly separated, creating a visual hierarchy that guides the viewer's focus.
How to Use It
This layout serves to present multi-series data comparisons effectively, making it suitable for business reviews or performance analyses. It fits well in a presentation sequence after introducing key metrics or trends. This slide can be used to highlight changes over time or compare multiple data sets, providing context for strategic decisions. It is ideal for analysts and managers who need to communicate insights clearly and concisely.
Text Placeholders & Capacity
Keep your copy within these limits so it fits without resizing. Body slots can hold approximately 30-40 words each.
| Placeholder | Count | Max characters (approx.) |
|---|---|---|
| Slide title | 1 | 30 |
| Body paragraph | 1 | 200 |
| Item body | 3 | 50 |
Slide Keywords
Download unlimited PowerPoint templates, charts and graphics for your presentations with our annual plan.
DOWNLOADReturn to Free Data-Driven Charts for PowerPoint.