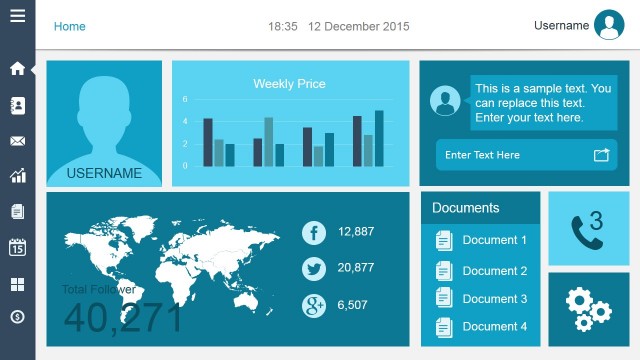
Slide 4 of 4 from Free Creative Dashboard UX Mockup PowerPoint Template
KPI Dashboard Design User Experience PPT
Curved Graph Sample for Dashboard Presentation
- Chart
- Other
- Statistics Slide
- 16:9
- 100% Editable
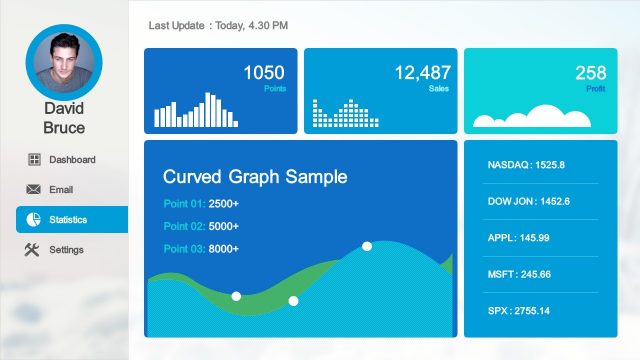
The Curved Graph Sample with Statistics slide from the Free Creative Dashboard UX Mockup PowerPoint Template offers a structured layout ideal for business presentations and sales reports. This slide template features editable shapes and vector icons to visually represent key performance indicators with a curved line graph and statistical boxes, making it suitable for data analysis summaries within a professional slide deck.
What’s on This Slide
The layout features a left sidebar with a circular image placeholder and text placeholders for a name and email. The main area displays four sections: a top row with two rectangular statistics boxes for points and sales, and a third box for profit. Below is a larger section titled 'Curved Graph Sample' with three data points listed. A curved line graph visually represents the data, with a gradient background. The overall composition is organized, with clear visual hierarchy and defined boundaries for each section.
How to Use It
This layout serves as a dashboard overview, ideal for presenting key performance indicators and statistics. It fits well in a presentation sequence that requires a summary of data insights, particularly after detailed analysis slides. This structure is useful for business reports, sales presentations, or user experience evaluations, where visual data representation is essential for decision-making.
Text Placeholders & Capacity
Keep your copy within these limits so it fits without resizing. Body slots can accommodate roughly 10-15 words each.
| Placeholder | Count | Max characters (approx.) |
|---|---|---|
| Slide title | 1 | 30 |
| Body paragraph | 1 | 100 |
| Item heading | 3 | 15 |
| Item body | 3 | 10 |
Slide Keywords
Download unlimited PowerPoint templates, charts and graphics for your presentations with our annual plan.
DOWNLOADReturn to Free Creative Dashboard UX Mockup PowerPoint Template.