Free Business Forecast PowerPoint Template
Download Free Business Forecast PowerPoint Template & Google Slides


The Free Business Forecast PowerPoint Template is a collection of decision making diagrams presentation. The forecasting helps organizations to estimate the budget, growth and outcome of the events. Through this, corporates can form management and marketing plans to get desire results. In short, it is the process of making future prediction for business based on trend analysis. It is an essential management PowerPoint for executive meeting. For example, explaining the future financial growth by new product development to the clients. Further, the entrepreneurs can present their innovative start up to the investors with the 3-5-year forecast. The project proposal presentation with the forecast has the higher chance of receiving financial investment.
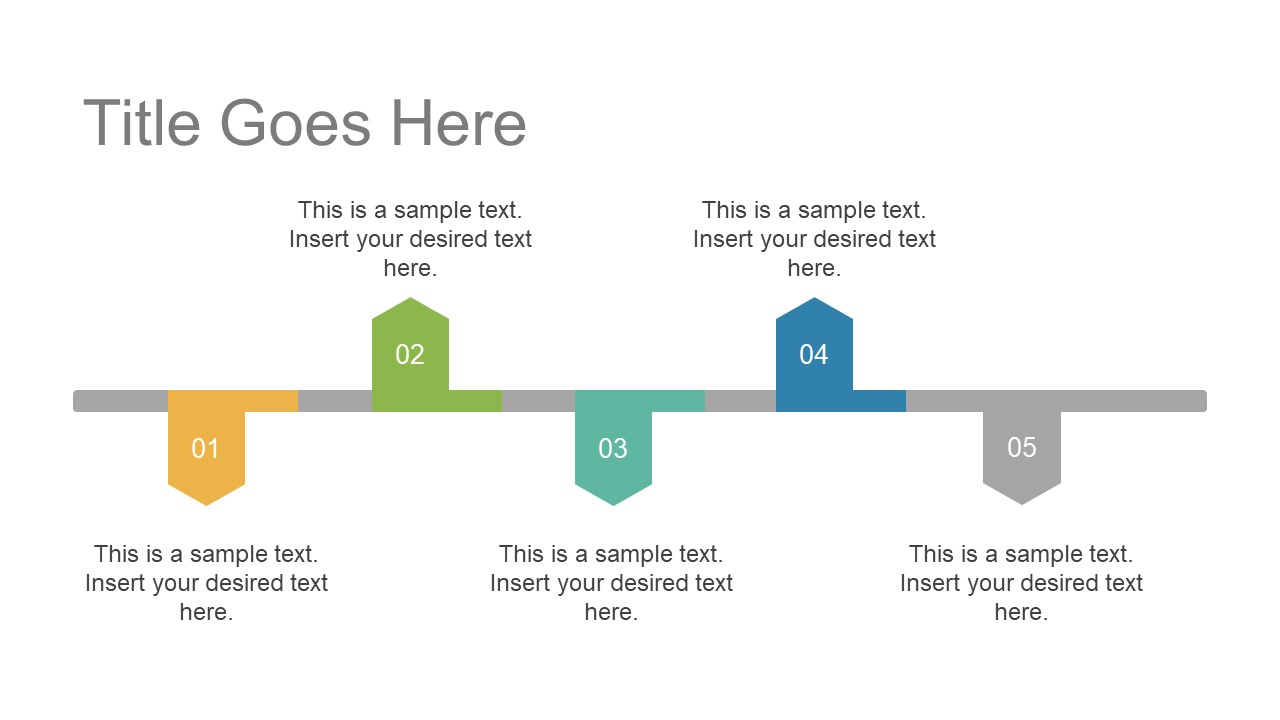
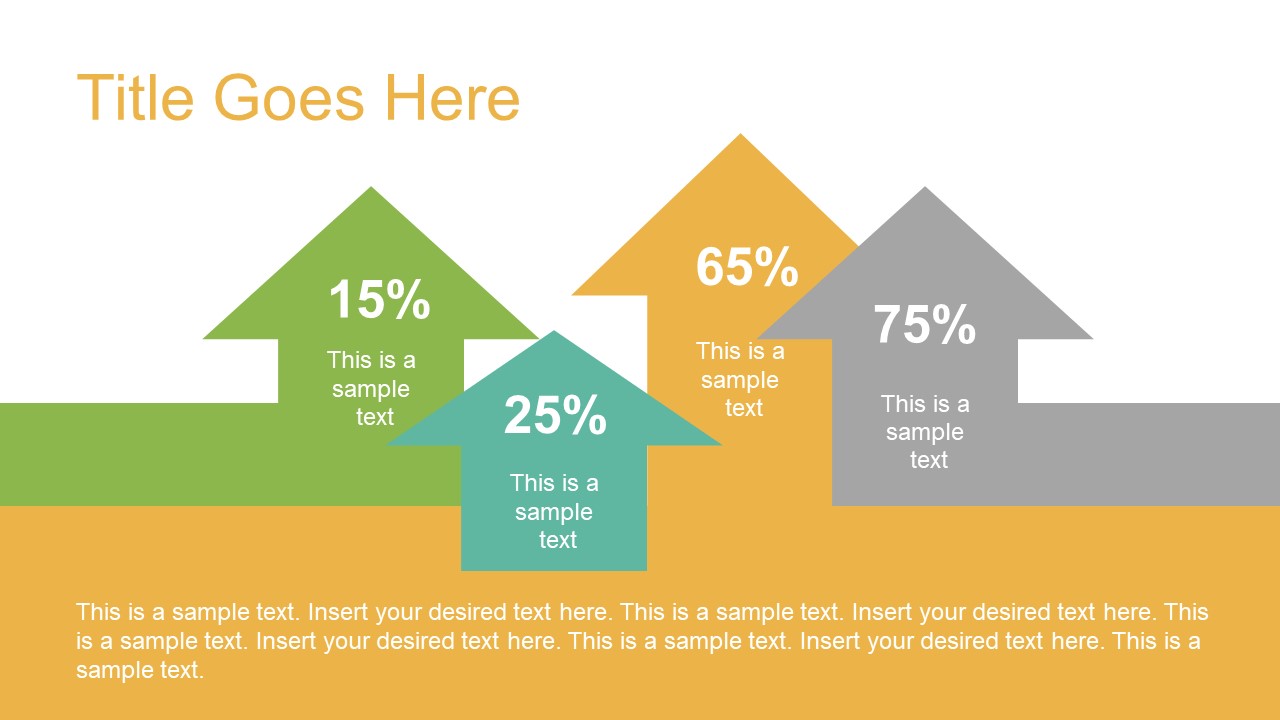
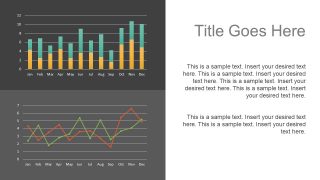
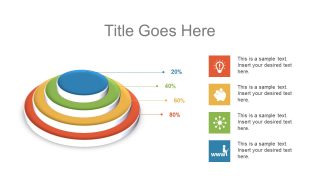
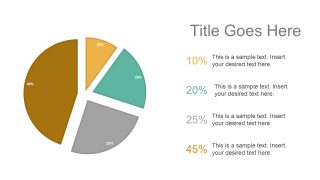
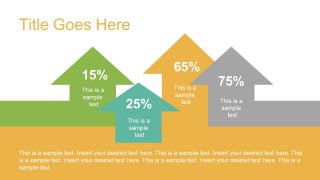
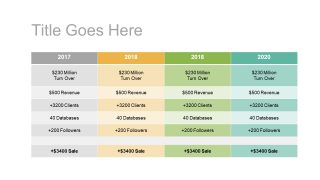
The Free Business Forecast PowerPoint Template is an outstanding set of 7 slides. It includes various timeline and data charts for statistical and trend analysis. The first template is a simple and clean horizontal timeline illustration to present project activities. Further, there are remarkable forecast slides of data driven bar, trend and pie charts. The PowerPoint contains a 4 levels circular pyramid diagram with the cool infographics to present every stage. Also, there are colorful templates to add features for the product or services. Moreover, the amazing slide of chevron style presentation is useful for statistical analysis.
This a high-quality business PowerPoint theme of chart templates, carefully design by to impress the audience. It is easily editable PowerPoint to customize properties of graphics like color, size, orientations etc. The data driven charts enable users to add various numerical values and functions to support the forecasting. There are three main properties of such diagrams, elements, style and filters. The option of filter assist in creating a spreadsheet using the select data option. Also, the users can add or delete variable in element option. This template can help create a comprehensive business forecast report which is appealing to the viewers.
FEATURES
- 100% Editable PowerPoint Templates & Google Slides.
- Compatible with all major Microsoft PowerPoint versions, Keynote and Google Slides.
- Modern 16:9 Aspect Ratio.
- Scalable Vectorial PowerPoint Shapes and PowerPoint Icons.
- Instant Access and Download.
- New Templates every week.
Google Slides Preview
Our PowerPoint Templates are compatible with Google Slides. Take the most of every platform using the tool you like.

