Slide 7 of 7 from Free Business Forecast PowerPoint Template
Yearly Forecast Table Chart Template
Business Forecast Data Overview Table
- Table
- Comparison Table
- Evaluation Slide
- 16:9
- 100% Editable
The Data Overview Table slide from the Free Business Forecast PowerPoint Template offers a clear, structured layout for comparing financial and client metrics across multiple years. This slide template is suitable for business presentations such as annual reports and performance reviews, providing editable slides that facilitate concise data evaluation and strategic analysis within a professional slide deck.
What’s on This Slide
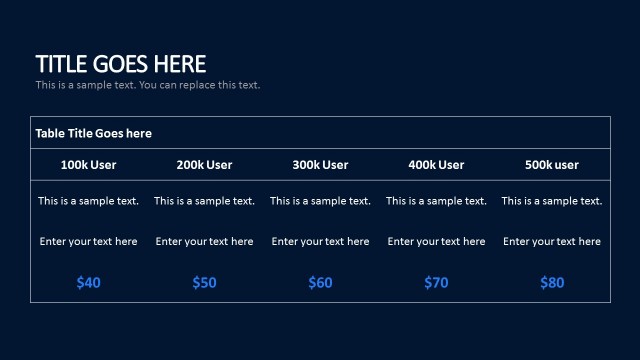
The slide features a structured table layout with four columns labeled 2017, 2018, 2018, and 2020. Each column contains rows with financial and client metrics, including turnover, revenue, clients, databases, followers, and sales. The rows are divided by horizontal lines, and the header cells are filled with distinct background colors. Text placeholders are present for the title at the top, which is centered, and each cell contains aligned text. The overall composition is organized and clear, allowing for easy comparison across the years.
How to Use It
This layout serves as a data overview table, ideal for presenting financial metrics and client statistics over multiple years. It fits well in a presentation sequence following detailed analysis slides, summarizing key performance indicators. This structure is useful in business contexts such as annual reports, performance reviews, or strategic planning sessions where comparisons across time periods are necessary.
Text Placeholders & Capacity
Keep your copy within these limits so it fits without resizing. Cell slots can accommodate tight text, roughly 4-5 words each.
| Placeholder | Count | Max characters (approx.) |
|---|---|---|
| Slide title | 1 | 30 |
| Cell | 24 | 20 |
Slide Keywords
Download unlimited PowerPoint templates, charts and graphics for your presentations with our annual plan.
DOWNLOADReturn to Free Business Forecast PowerPoint Template.