Free Bottleneck Diagram Template for PowerPoint
Download Free Bottleneck Diagram Template for PowerPoint & Google Slides
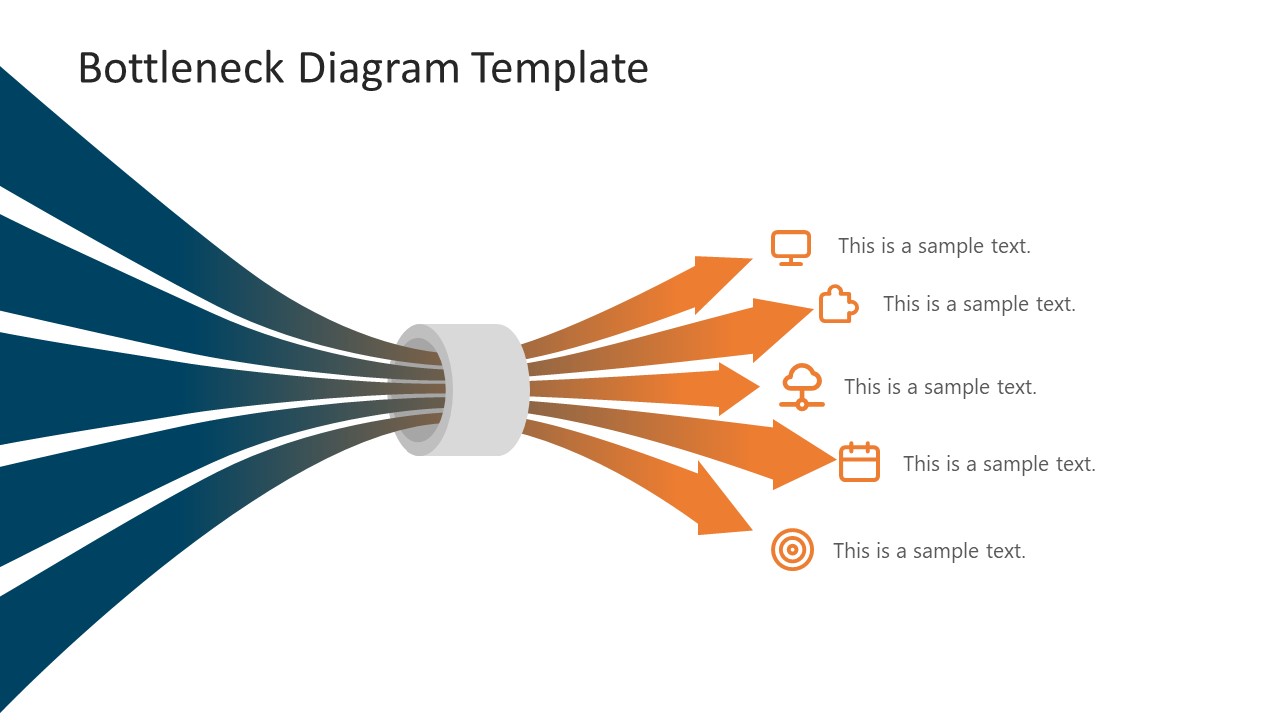
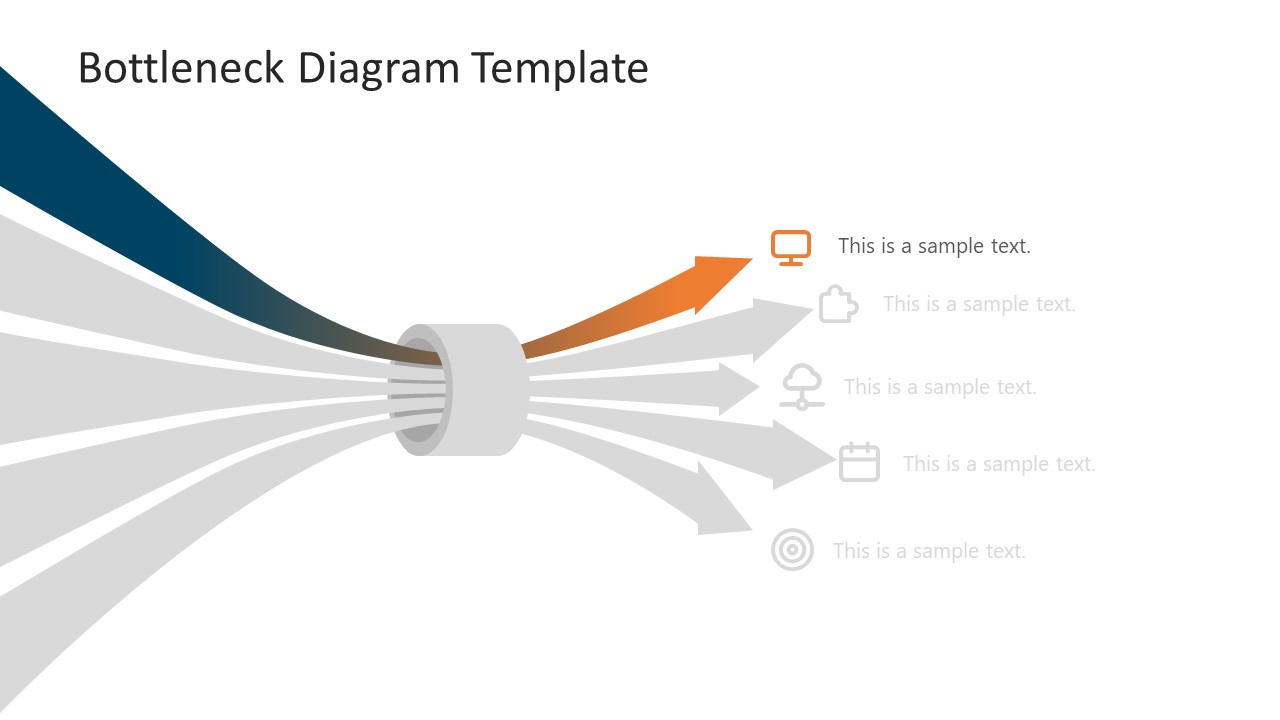
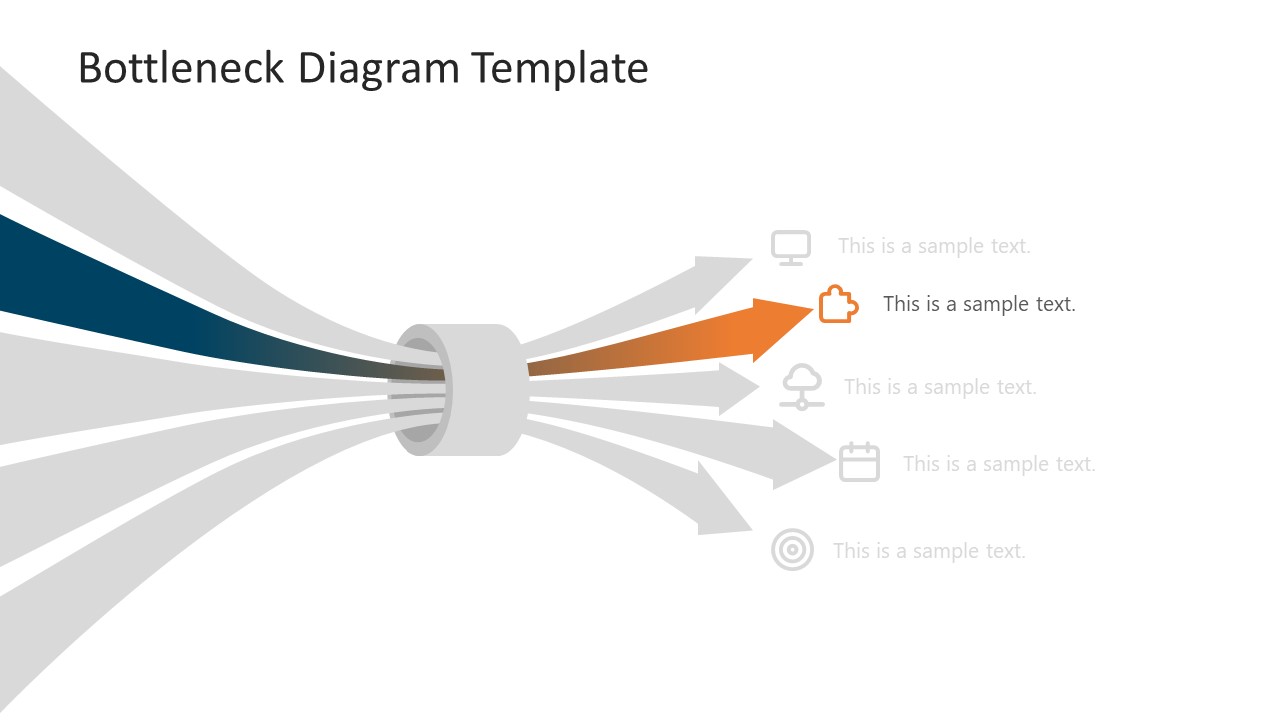
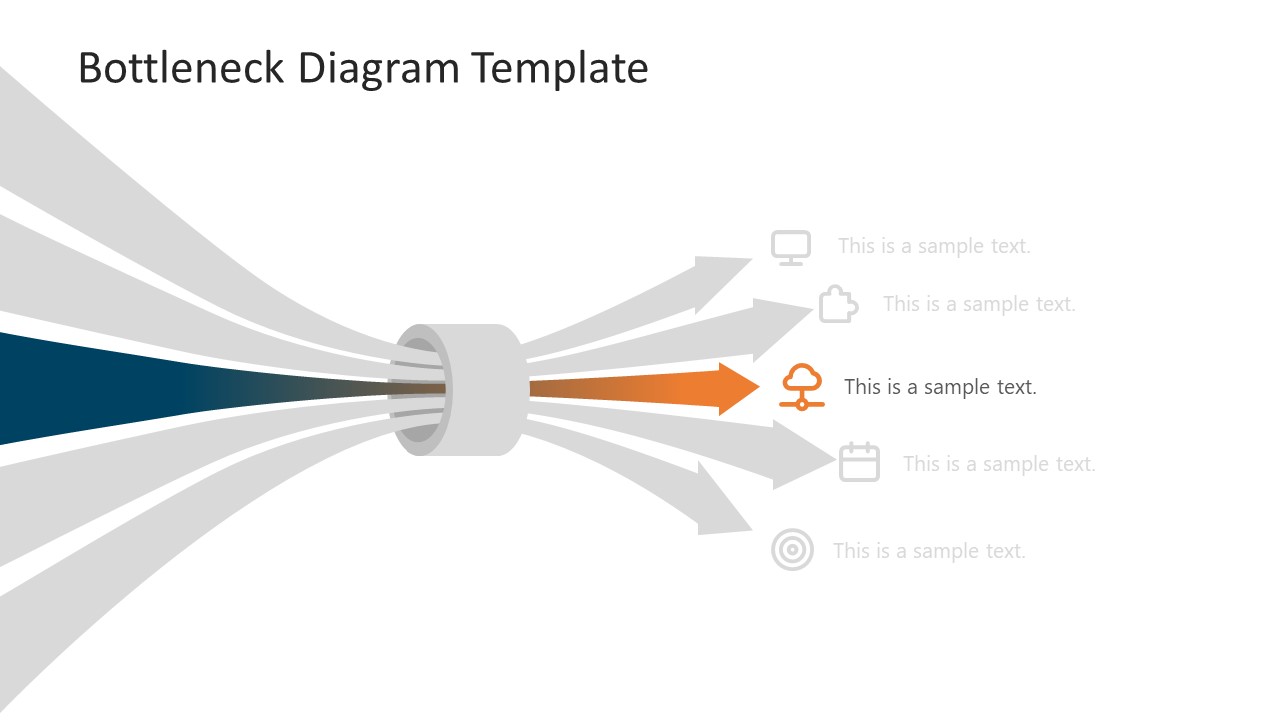
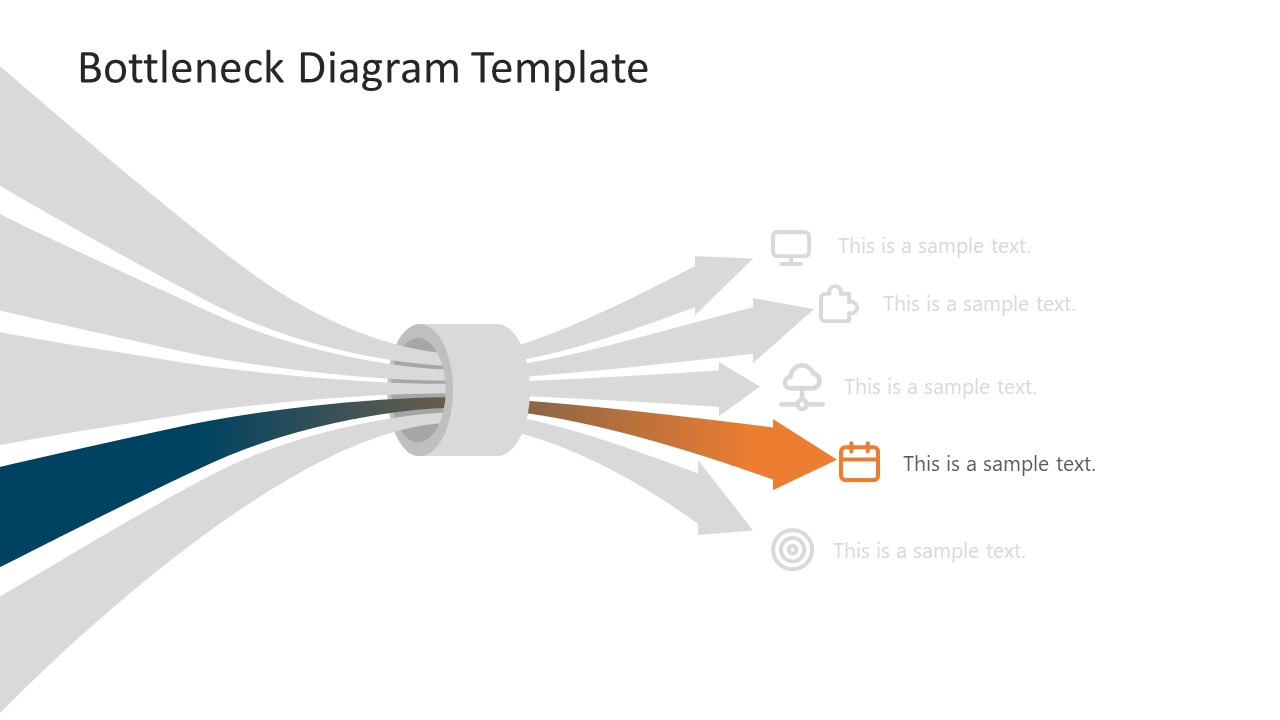
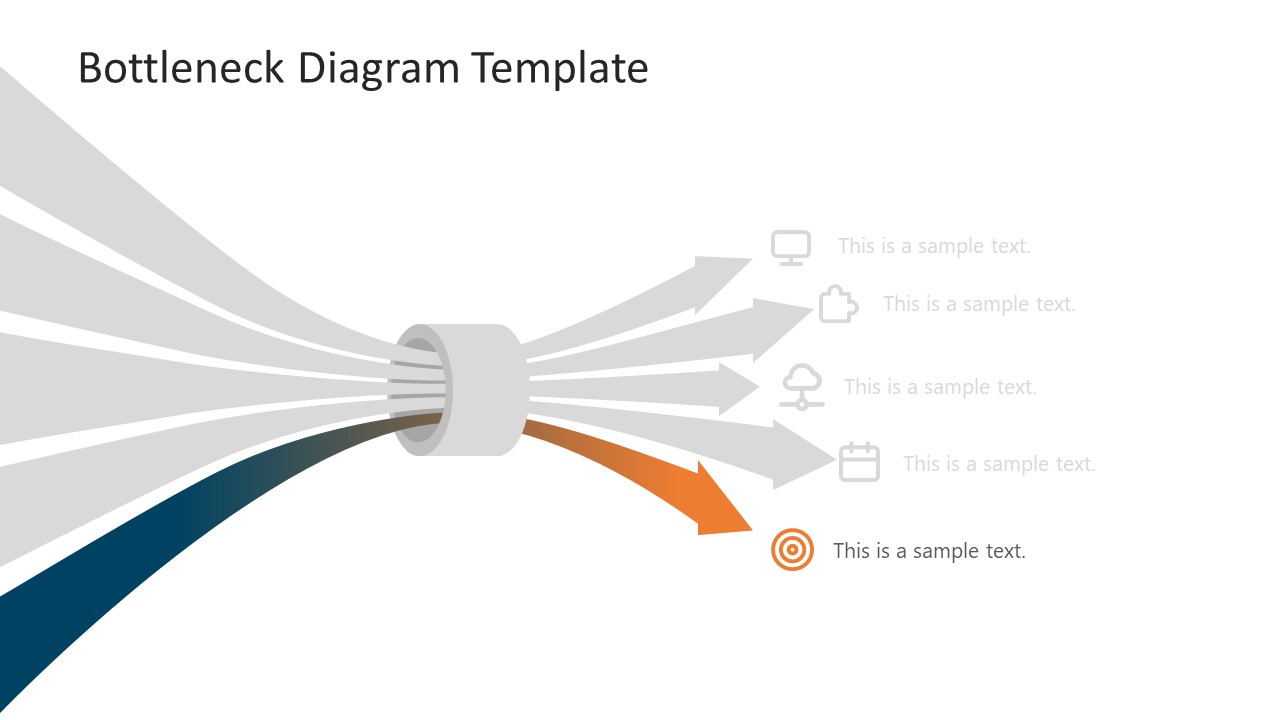
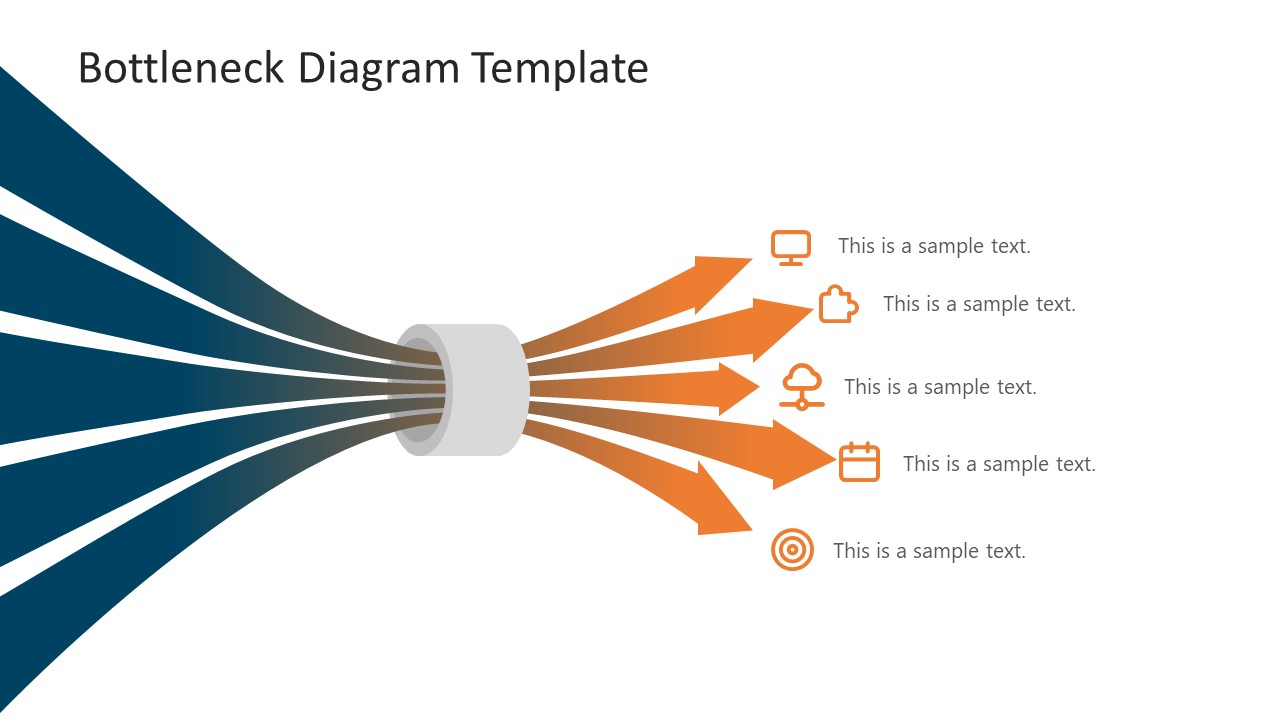
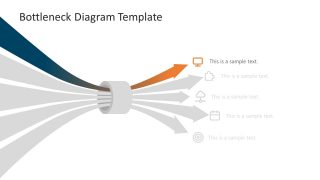
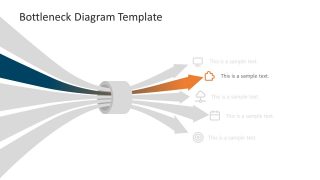
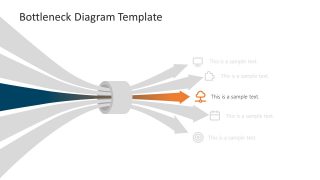
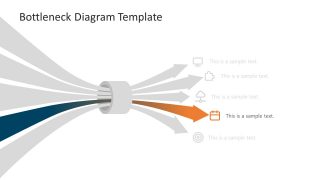
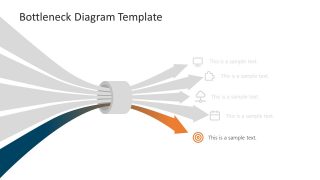
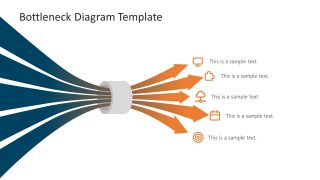
The Free Bottleneck Diagram Template for PowerPoint is a 5 steps diagram of gradient arrows. The Arrows passing through a ring represent the concept of interruption that causes delay. It shows five arrows in a horizontal flow that narrowly passes a ring i.e. bottleneck. The arrow flows outside the bottleneck with clipart icons at the end. Blue and orange gradient colors represent the transformation of moving out of the bottleneck.
In business operations, a bottleneck is when production is not meeting maximum throughput capacity. It could lead to a delay or halt in the flow of operations. Similar to the narrow point of water flow where a narrowing path reduces the rate at which water flows. The PowerPoint bottleneck metaphor can commonly be used in management and logistics to help visualize and identify delays.
The free slides for the bottleneck diagram template help you discuss inefficiencies in business that cause interruptions. You can use 5 arrows template to describe a point in a workflow that affects five separate processes. Business analysts, managers, and owners use a simple bottleneck diagram template to discuss how one problematic area affects the entire production. The project team can use Free Bottleneck Diagram Template for PowerPoint to highlight a significant increase in time and cost of business processes.
The bottleneck diagram PowerPoint template is a free layout containing seven slides. There are five slides that illustrate each color-coded arrow and its symbol representation. These symbols are infographic icons including computer screen, puzzle, cloud connection, calendar, and dartboard. You can create an appealing PowerPoint presentation to communicate business or manufacturing bottlenecks. Alternatively, you can download our 100% editable bottleneck PPT templates.
FEATURES
- 100% Editable PowerPoint Templates & Google Slides.
- Compatible with all major Microsoft PowerPoint versions, Keynote and Google Slides.
- Modern 16:9 Aspect Ratio.
- Scalable Vectorial PowerPoint Shapes and PowerPoint Icons.
- Instant Access and Download.
- New Templates every week.
Google Slides Preview
Our PowerPoint Templates are compatible with Google Slides. Take the most of every platform using the tool you like.
