Slide 6 of 7 from Free Bottleneck Diagram Template for PowerPoint
Arrow Template Step 5 Bottleneck PowerPoint
Bottleneck Diagram for Presentations
- Diagram
- Bottleneck
- Process Slide
- 16:9
- 100% Editable
The Bottleneck Diagram with Arrows slide from the Free Bottleneck Diagram Template for PowerPoint visually represents process flows and operational constraints using editable shapes and arrows. This slide template is ideal for business presentations and pitch decks that require clear identification of bottlenecks and workflow optimization. It integrates well within slide decks focused on project management and operational efficiency, offering a structured way to discuss process limitations and potential solutions.
What’s on This Slide
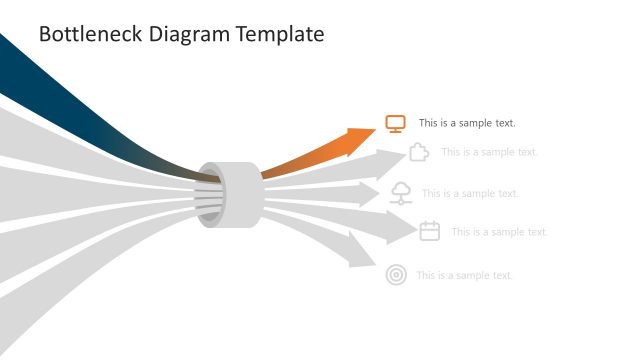
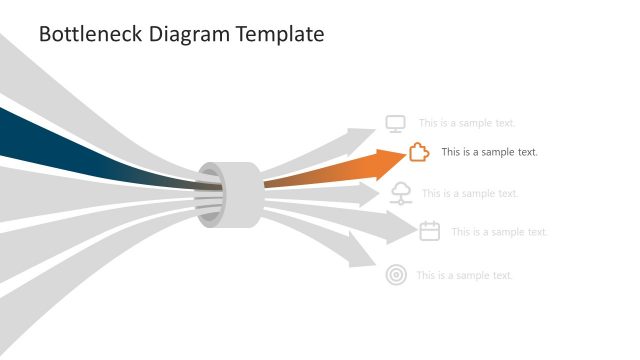
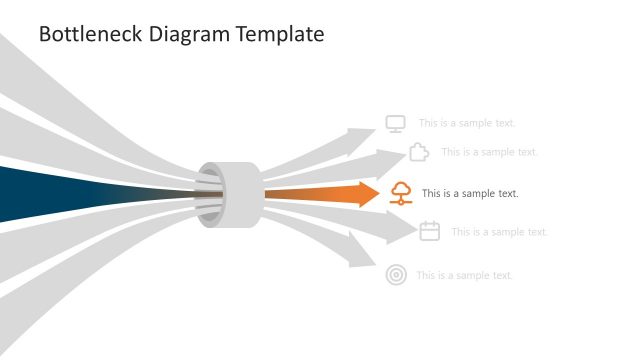
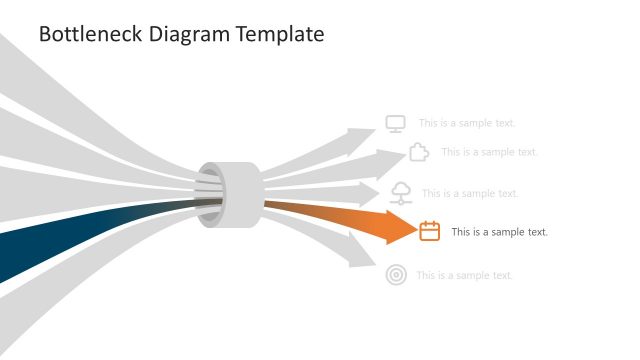
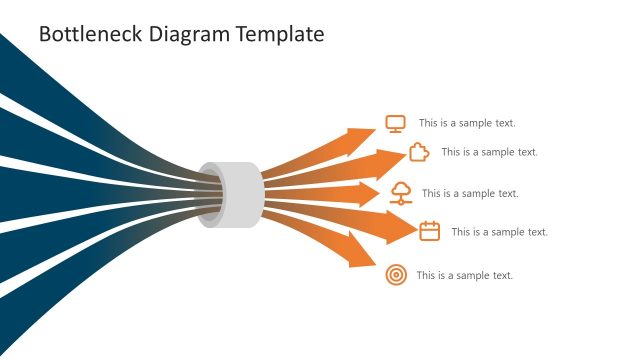
The layout features a central bottleneck shape with five arrows emerging from it, pointing in various directions. The arrows are arranged in a fan-like pattern, with the leftmost arrow colored dark blue, followed by three gray arrows, and the rightmost arrow in orange. Each arrow has a text placeholder aligned to the right, indicating where sample text can be inserted. The visual hierarchy emphasizes the central bottleneck, while the arrows represent different pathways or options. A circular target icon is placed beneath the orange arrow, accompanied by a text placeholder.
How to Use It
This layout serves as a bottleneck diagram, illustrating processes or decision points in a presentation. It is suitable for business contexts where identifying constraints or flow issues is necessary. This slide fits well after problem identification slides and before proposing solutions. It can be used in discussions about operational efficiency, project management, or workflow optimization, providing a clear visual representation of bottlenecks and their implications.
Text Placeholders & Capacity
Keep your copy within these limits so it fits without resizing. Node body slots can hold roughly 30 characters each.
| Placeholder | Count | Max characters (approx.) |
|---|---|---|
| Item body | 5 | 30 |
| Item body | 1 | 30 |
Slide Keywords
Download unlimited PowerPoint templates, charts and graphics for your presentations with our annual plan.
DOWNLOAD