Slide 5 of 32 from #2 Editable Data Driven Maps Bundle
World Map PowerPoint for Continents
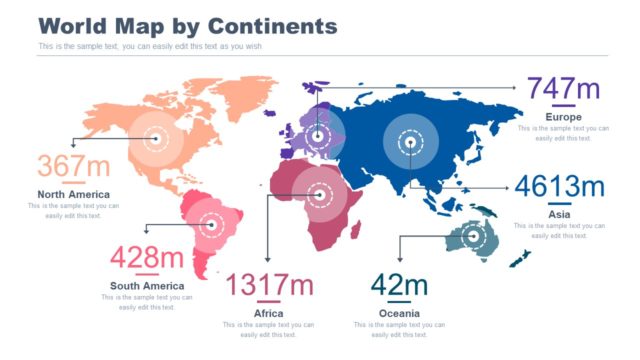
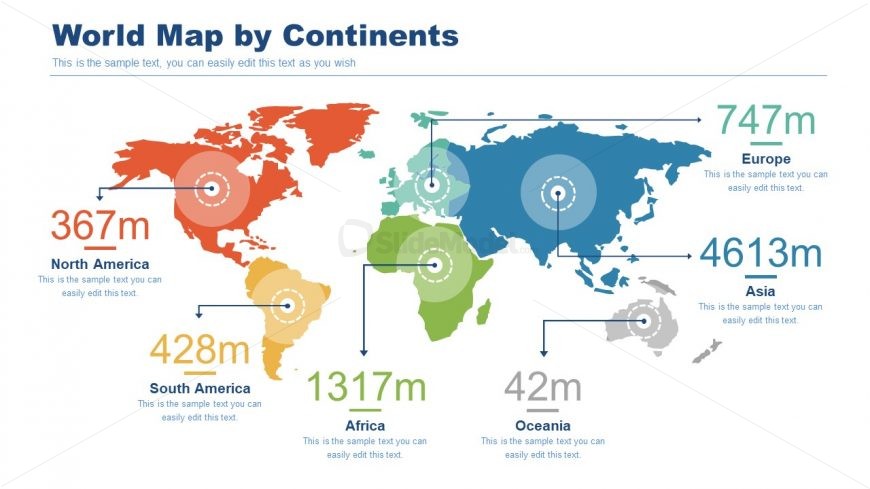
World Map by Continents Presentation Slide
- Map
- World Map
- Context Slide
- 16:9
- 100% Editable
The World Map by Continents slide from the #2 Editable Data Driven Maps Bundle offers a clear geographic overview for demographic analysis and market research presentations. This slide template includes editable shapes and vector icons to visually represent population data across continents, making it a practical choice for business presentations and geographic data reporting within a professional slide deck.
What’s on This Slide
The slide features a world map divided by continents, with each continent labeled and accompanied by population figures. North America, South America, Europe, Africa, Asia, and Oceania are represented. Each continent has a circular node indicating its population, connected by lines to the map. Text placeholders are positioned below each continent's label, aligned centrally. The title is prominently displayed at the top. The overall color scheme includes shades of blue and green, with a white background enhancing visibility. Icons and text are clearly organized for easy comprehension.
How to Use It
This layout serves as a geographic overview, ideal for presenting demographic data across continents. It fits well in a presentation sequence following a problem statement or introduction, providing a visual representation of population distribution. This slide is suitable for business scenarios involving market analysis, demographic studies, or geographic reporting. It can be used to highlight regional differences or trends in population data, making it valuable for analysts and presenters in various fields.
Text Placeholders & Capacity
Keep your copy within these limits so it fits without resizing. Node labels can accommodate around 2-3 words each.
| Placeholder | Count | Max characters (approx.) |
|---|---|---|
| Slide title | 1 | 30 |
| Item heading | 6 | 15 |
| Item body | 6 | 50 |
Slide Keywords
Download unlimited PowerPoint templates, charts and graphics for your presentations with our annual plan.
DOWNLOADReturn to #2 Editable Data Driven Maps Bundle.