Slide 9 of 32 from #2 Editable Data Driven Maps Bundle
PowerPoint World Map Country Template
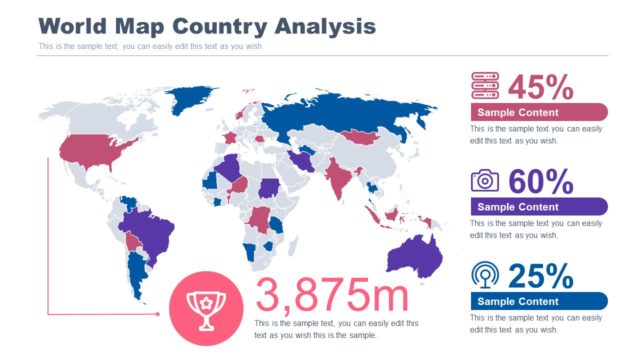
World Map Country Analysis Slide
- Map
- World Map
- Data Analysis Slide
- 16:9
- 100% Editable
The World Map Country Analysis slide from the #2 Editable Data Driven Maps Bundle offers a clear layout for visualizing geographic data trends. This slide template is designed for business presentations requiring detailed market analysis and demographic insights, featuring editable shapes and vector icons to highlight regional performance effectively. Its clean design supports data-driven storytelling within corporate slide decks and pitch deck templates.
What’s on This Slide
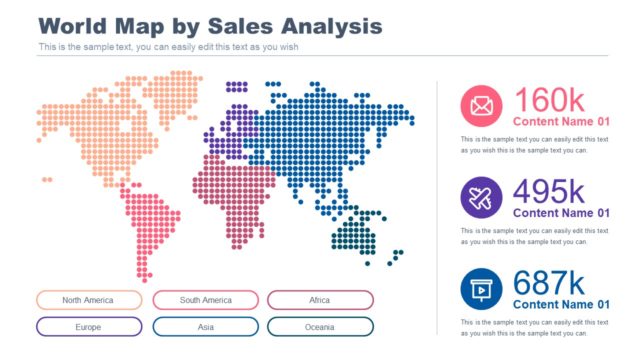
The slide features a world map centered in the middle, colored to represent different data points across countries. Text placeholders are positioned on the right side, with four sections displaying percentages and sample content, aligned vertically. A trophy icon is placed below the map, accompanied by a numeric placeholder indicating a measurement. The title is prominently displayed at the top in bold, blue font. The overall layout is clean, with a light background and a color scheme that emphasizes the map and data points without cluttering the visual hierarchy.
How to Use It
This layout serves as a geographic analysis tool, ideal for presenting data-driven insights about countries. It fits well in a presentation sequence after introducing a problem or context, providing a visual representation of data trends. Business scenarios include market analysis, demographic studies, and regional performance reviews. The slide can be used to highlight key statistics and geographical insights effectively, making it suitable for analysts and presenters in various industries.
Text Placeholders & Capacity
Keep your copy within these limits so it fits without resizing. Node body slots can accommodate roughly 8-10 words each.
| Placeholder | Count | Max characters (approx.) |
|---|---|---|
| Slide title | 1 | 30 |
| Item body | 4 | 50 |
| Item heading | 4 | 10 |
Slide Keywords
Download unlimited PowerPoint templates, charts and graphics for your presentations with our annual plan.
DOWNLOADReturn to #2 Editable Data Driven Maps Bundle.