Slide 13 of 32 from #2 Editable Data Driven Maps Bundle
Silhouette Continent Maps in PowerPoint
Editable Continents Map for Presentations
- Map
- Continent Map
- Context Slide
- 16:9
- 100% Editable
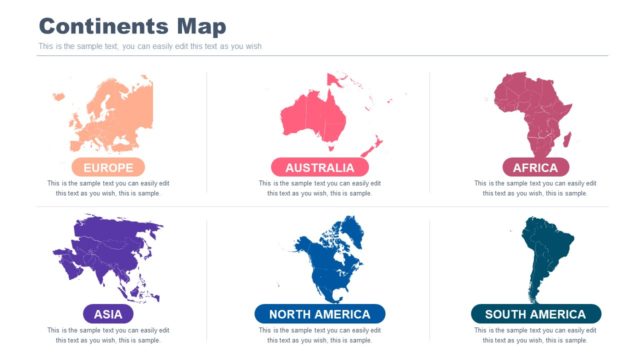
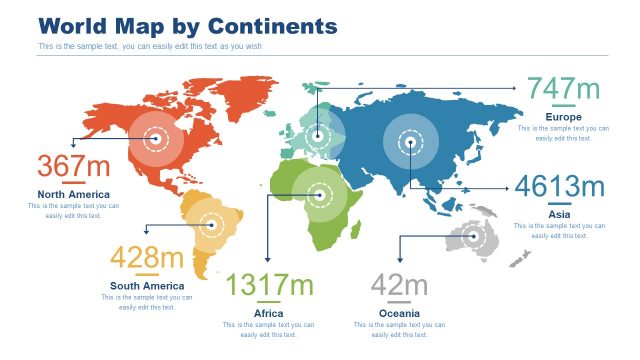
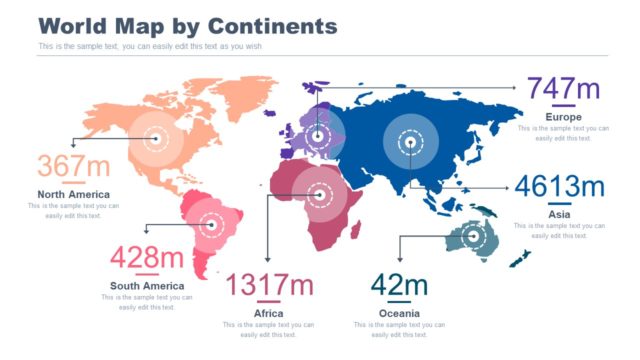
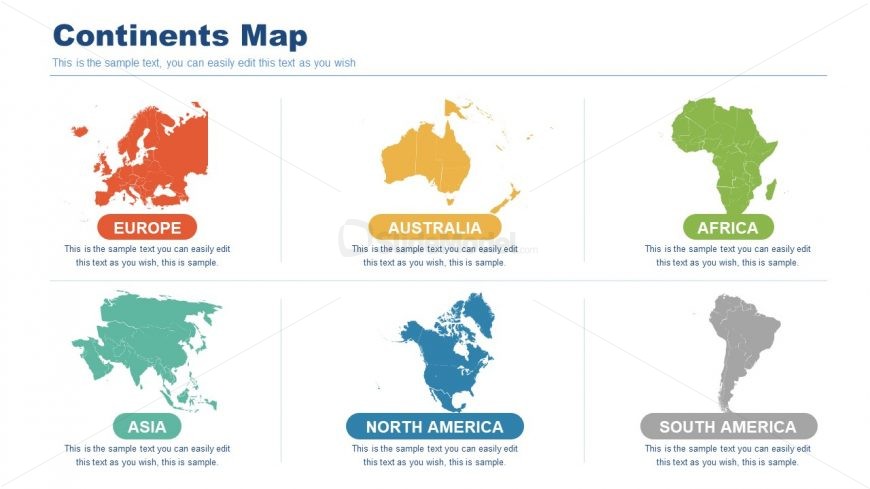
The Continents Map slide from the #2 Editable Data Driven Maps Bundle offers a clear geographic overview with six distinct continent maps, ideal for business presentations or educational reports. This slide layout supports regional performance reviews and demographic analysis using editable shapes and color-coded visuals, enhancing clarity in slide decks and pitch deck templates.
What’s on This Slide
The layout features six continent maps arranged in two rows. Each map is labeled with the continent name below it, using a bold font. The maps are colored differently to distinguish each continent, with Europe in orange, Australia in yellow, Africa in green, Asia in teal, North America in blue, and South America in gray. Text placeholders are positioned below each map, aligned centrally. The overall composition is balanced, with ample white space around the elements, enhancing clarity and focus on the maps.
How to Use It
This layout serves as a geographic overview, ideal for presentations discussing global demographics or regional analyses. It fits well after introductory content, providing a visual representation of continents. This structure is useful for business scenarios such as market entry strategies, regional performance comparisons, or educational contexts focusing on geography. It can be employed in reports, proposals, or educational materials to illustrate geographic data effectively.
Text Placeholders & Capacity
Keep your copy within these limits so it fits without resizing. Node body slots can accommodate roughly 15-20 words each.
| Placeholder | Count | Max characters (approx.) |
|---|---|---|
| Item heading | 6 | 20 |
| Item body | 6 | 100 |
Slide Keywords
Download unlimited PowerPoint templates, charts and graphics for your presentations with our annual plan.
DOWNLOADReturn to #2 Editable Data Driven Maps Bundle.