Slide 23 of 32 from #2 Editable Data Driven Maps Bundle
Asia Outline Map PowerPoint for Analysis
Editable Asia Map with Data Points
- Map
- Country Map
- Context Slide
- 16:9
- 100% Editable
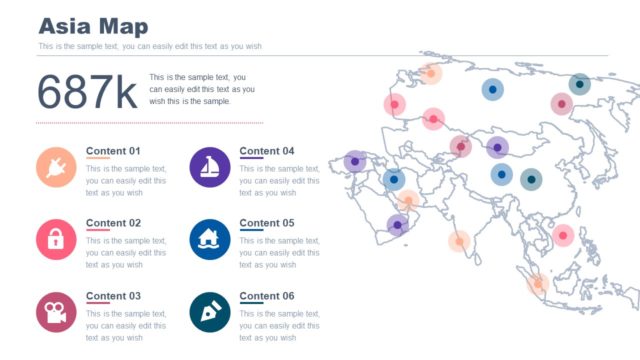
The Asia Map with Data Points slide from the #2 Editable Data Driven Maps Bundle offers a clear layout for geographic data presentation. This slide template combines a vector map of Asia with editable shapes and data icons, making it suitable for demographic analysis and regional reporting in business presentations or educational slide decks.
What’s on This Slide
The slide features a map of Asia positioned on the right side, outlined in a light blue color. To the left, there is a title at the top stating 'Asia Map' in bold blue font, followed by a numerical data point of '687k' in a large font. Below this, there are six circular icons arranged vertically, each representing different content sections. Each icon is accompanied by a label, with placeholders for text aligned to the left. The icons vary in color and shape, providing a visual distinction. The overall layout is clean and structured, with a light background enhancing readability.
How to Use It
This layout serves as a geographic data presentation, effectively showcasing demographic or statistical information related to Asia. It fits well in a sequence following an introduction or overview slide, transitioning into detailed analysis. This format is suitable for business reports, educational presentations, or any scenario requiring geographic data visualization. It allows for clear communication of key statistics alongside a map, making it ideal for analysts and presenters focusing on regional insights.
Text Placeholders & Capacity
Keep your copy within these limits so it fits without resizing. Body slots can accommodate roughly 20-30 words each.
| Placeholder | Count | Max characters (approx.) |
|---|---|---|
| Slide title | 1 | 20 |
| Body paragraph | 1 | 150 |
| Item heading | 6 | 20 |
Slide Keywords
Download unlimited PowerPoint templates, charts and graphics for your presentations with our annual plan.
DOWNLOADReturn to #2 Editable Data Driven Maps Bundle.