As our content catalog has grown, we have started to publish free PowerPoint slides every new week. Our free slides have had a very good adoption and we could also notice the number of free downloads is increasing over time. Reusing our 100% editable PowerPoint diagrams and slides can help to save many hours of work per week while you can produce visually appealing presentations.
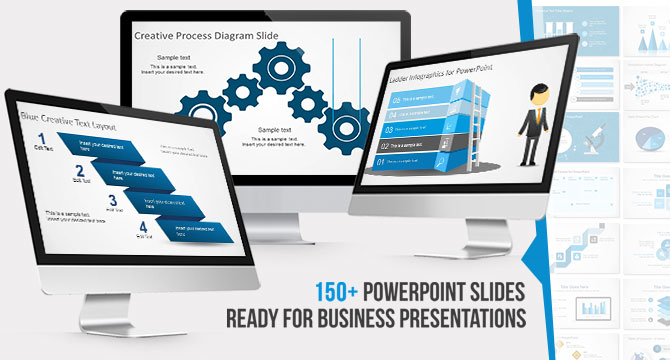
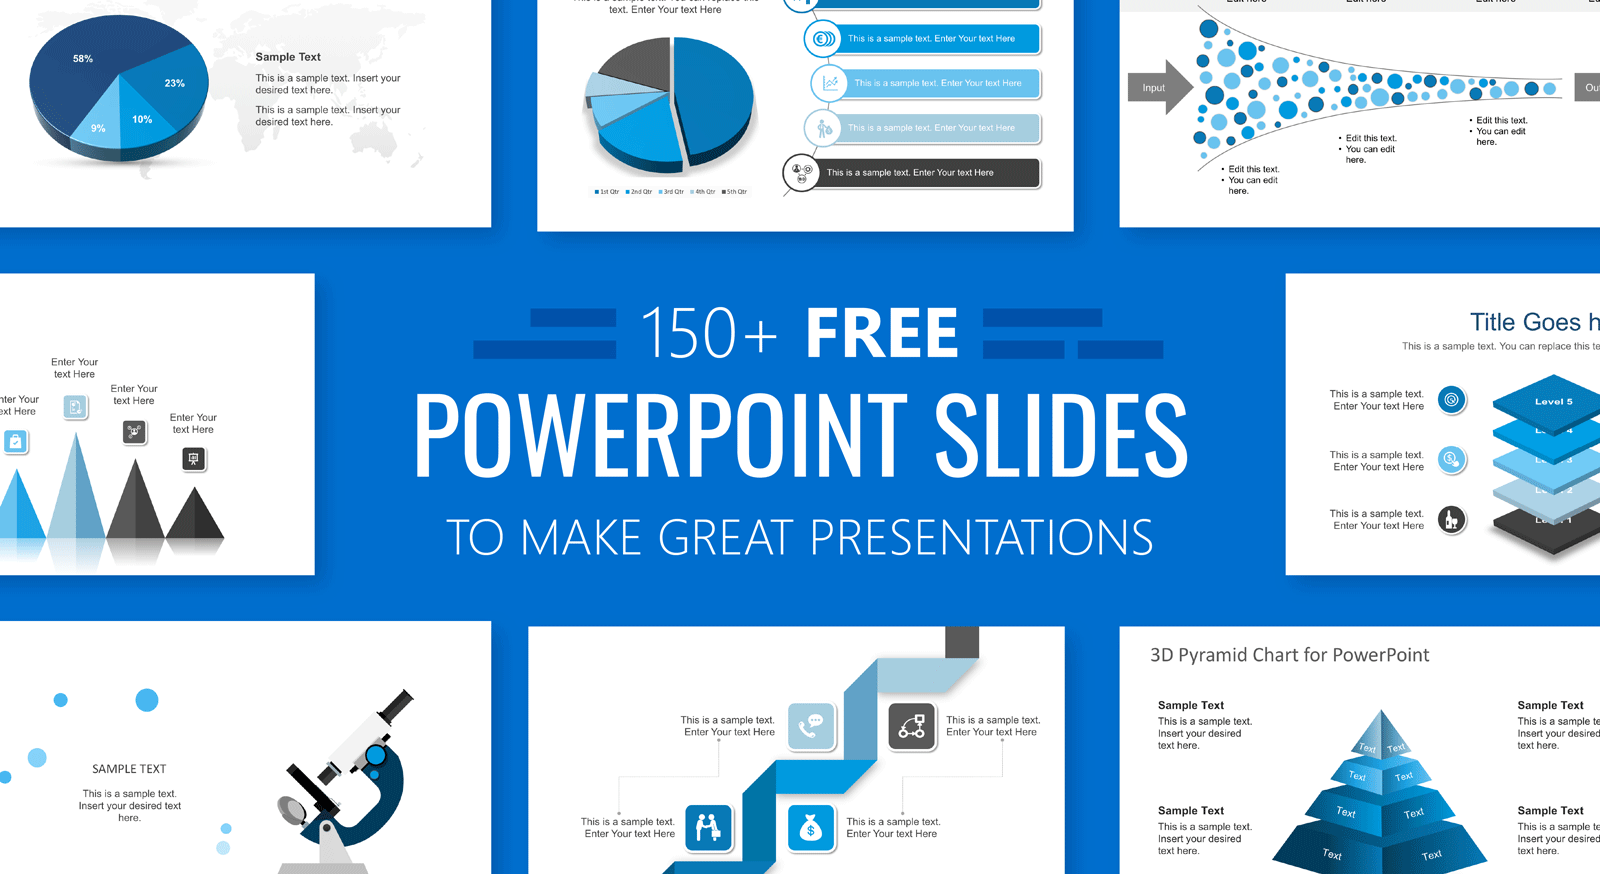
As if this were not enough, recently we have published a Mega Bundle containing more than 150+ PowerPoint slides (for FREE download). Here is a compilation of some of our top free PowerPoint slide designs that you can use the next time you need to make a business presentation.
If you prefer to download individual free slides, you can check out our free PowerPoint templates section where we publish a new slide every week.
1. Free Circular Concept Diagram Design
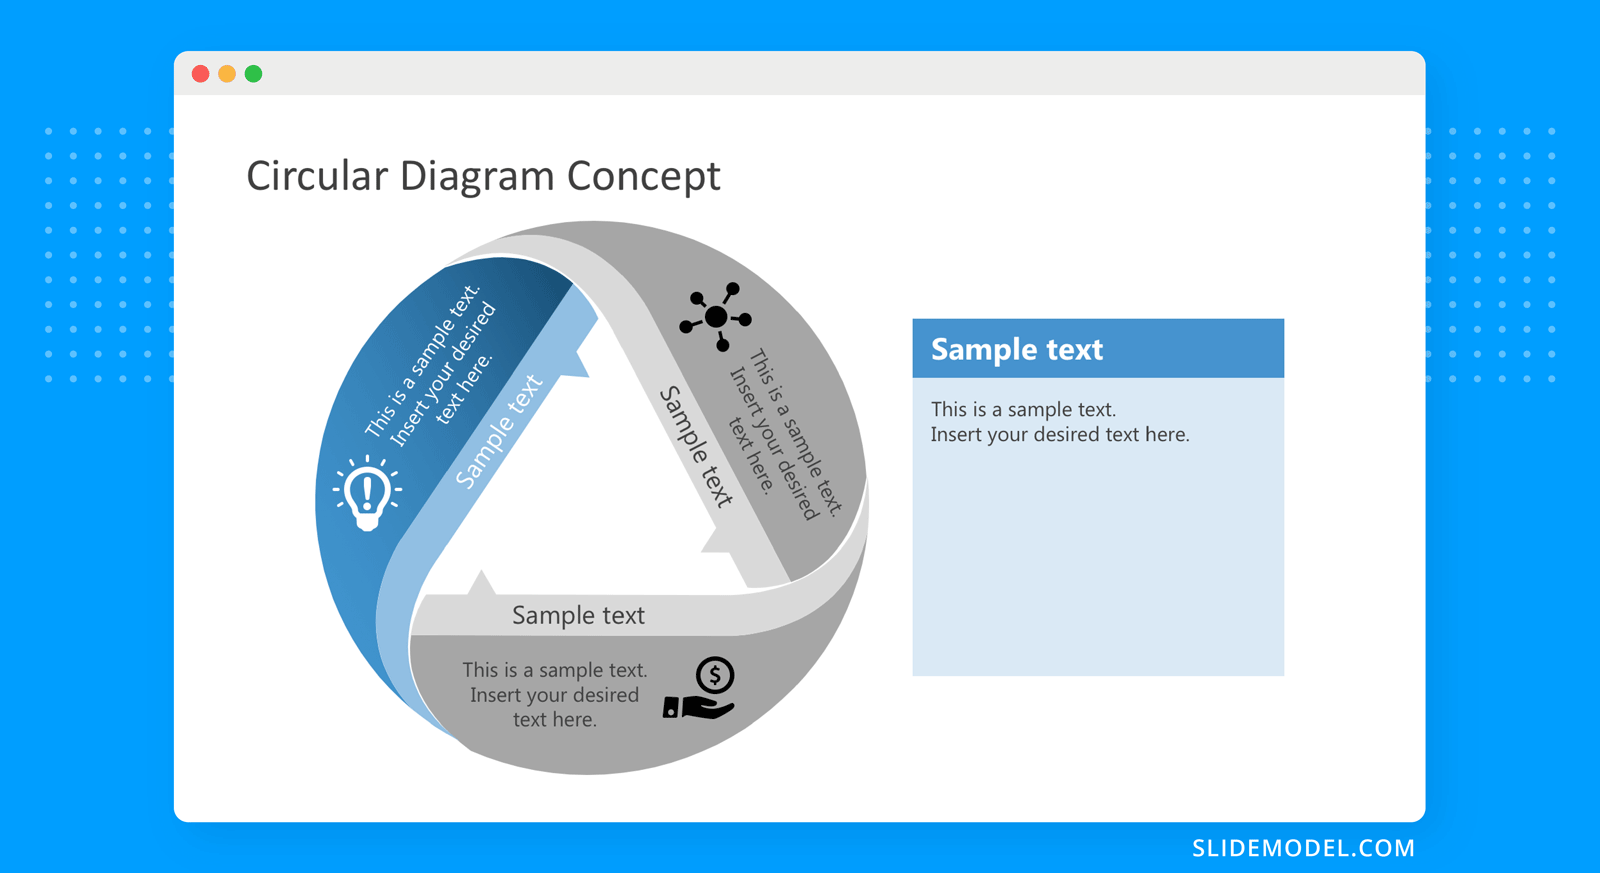
Free circular diagram concept is a three-component diagram design with editable text and icons that were created with PowerPoint shapes. This circular diagram can be used to describe a simple circular process or cycle flow. Given that it was created with PowerPoint shapes. You can easily change the shape properties such as colors or resize without losing image quality.
2. Free SWOT PowerPoint Slides
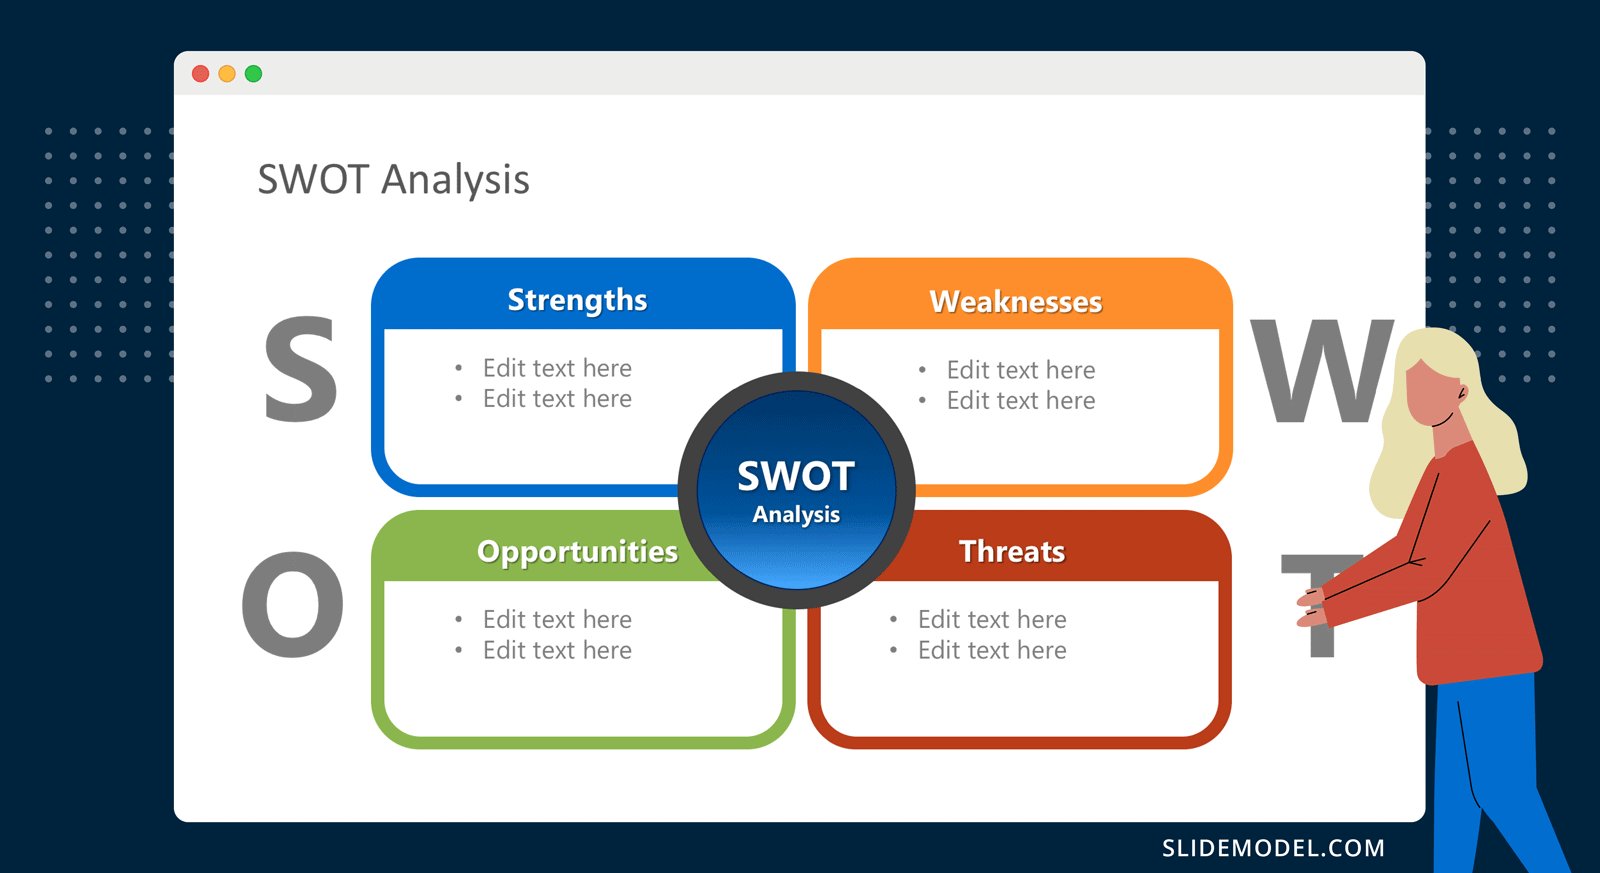
SWOT diagrams are always useful to carry out a SWOT analysis. This free SWOT slide can help you to make visually appealing marketing presentations that delight your audience. The SWOT Analysis template includes four text components to complete including strengths, weaknesses, opportunities and threats. You can download free SWOT templates for PowerPoint or editable versions of SWOT slides.
3. Free Funnel Diagram Design for PowerPoint
Funnel diagrams are very useful on any business and sales presentation. Using funnel diagrams, you can easily explain the steps toward generating sales in your company. The visual funnel representation can include several steps from the customer acquisition to the conversion or final purchase.

4. Free Business Model Canvas PowerPoint Slides
The Business Model Canvas is a strategic management and entrepreneurial tool developed by Alex Osterwalder. By using the Business Model Canvas slide you can easily describe, design, challenge, invent, and pivot your business model. You can visually describe a business model by completing the nine business model canvas blocks.
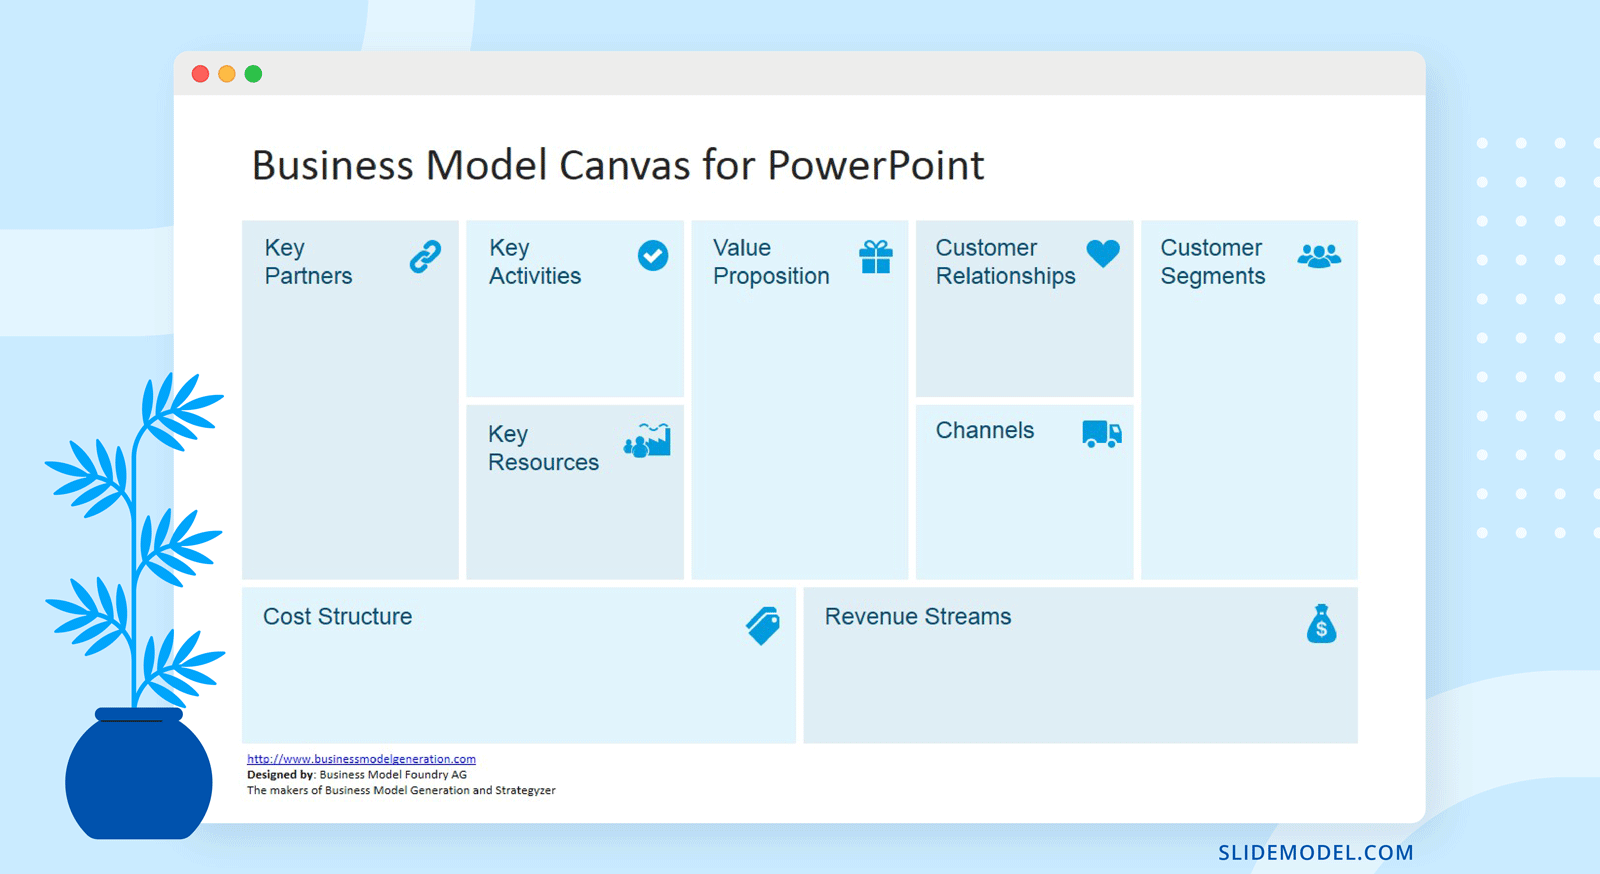
If you are an entrepreneur launching a new product or business, you can use this free slide as a Lean Canvas template by Ash Maurya or combine it with other advanced canvas and PowerPoint layouts like the Value Proposition Canvas template or even the Lean Canvas template.
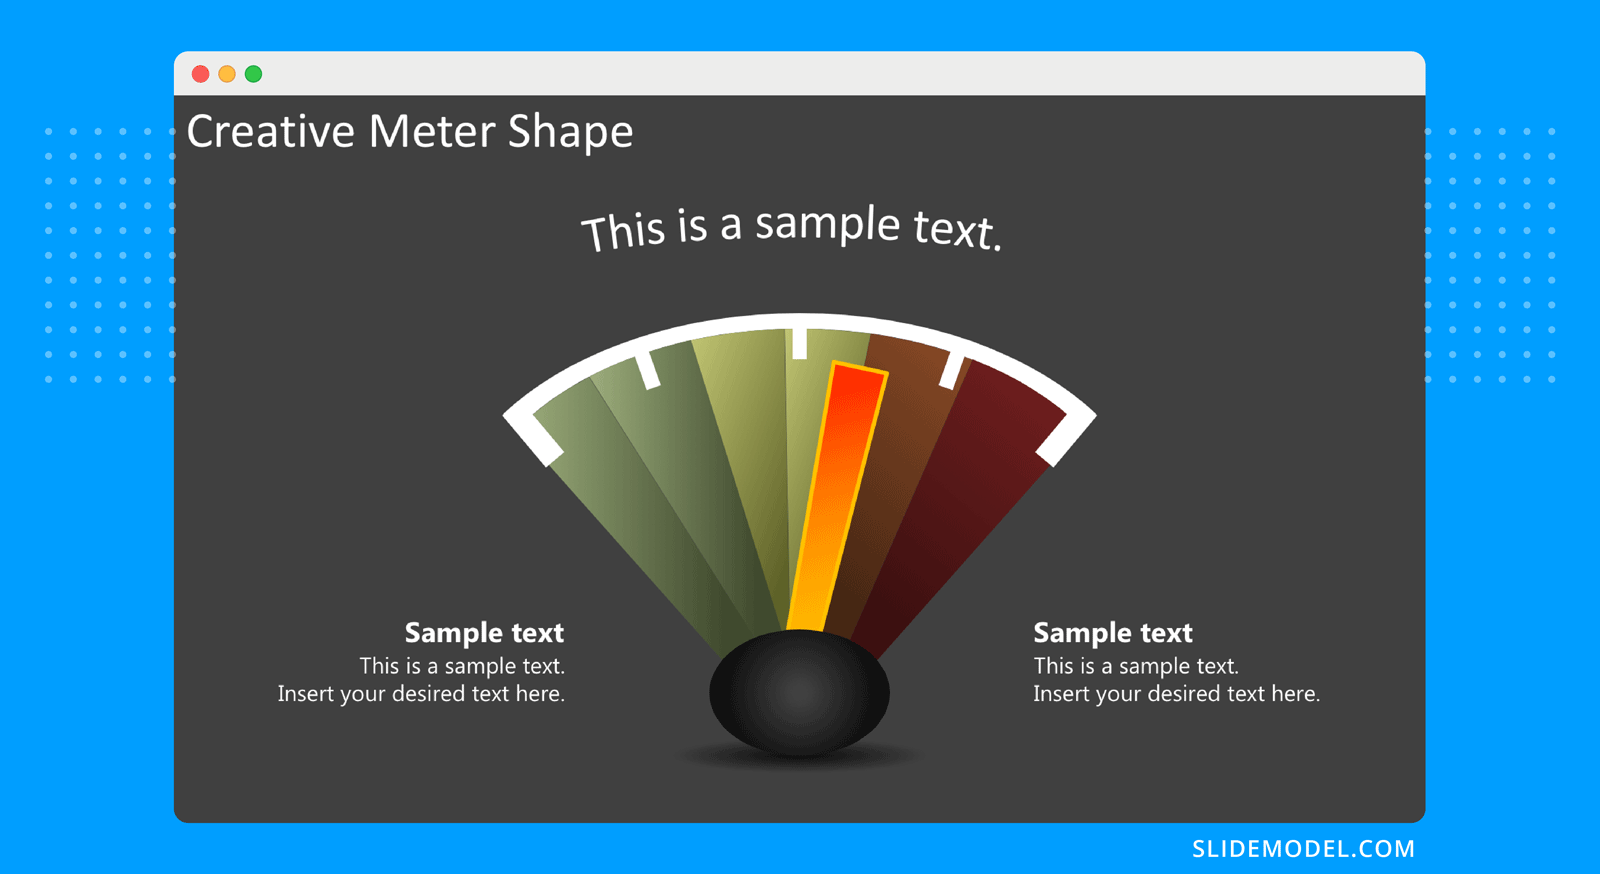
5. Free Creative Meter Slide Shapes
PowerPoint dashboards can be used to show key performance indicators within your organization, project or startup. You can monitor and review KPI’s to ensure profitability. Using visual indicators like the creative meter shape for PowerPoint you can easily show the level of a KPI in a dashboard presentation. Alternatively, you can use other nice meter charts like thermometers for PowerPoint or our speedometer shapes.
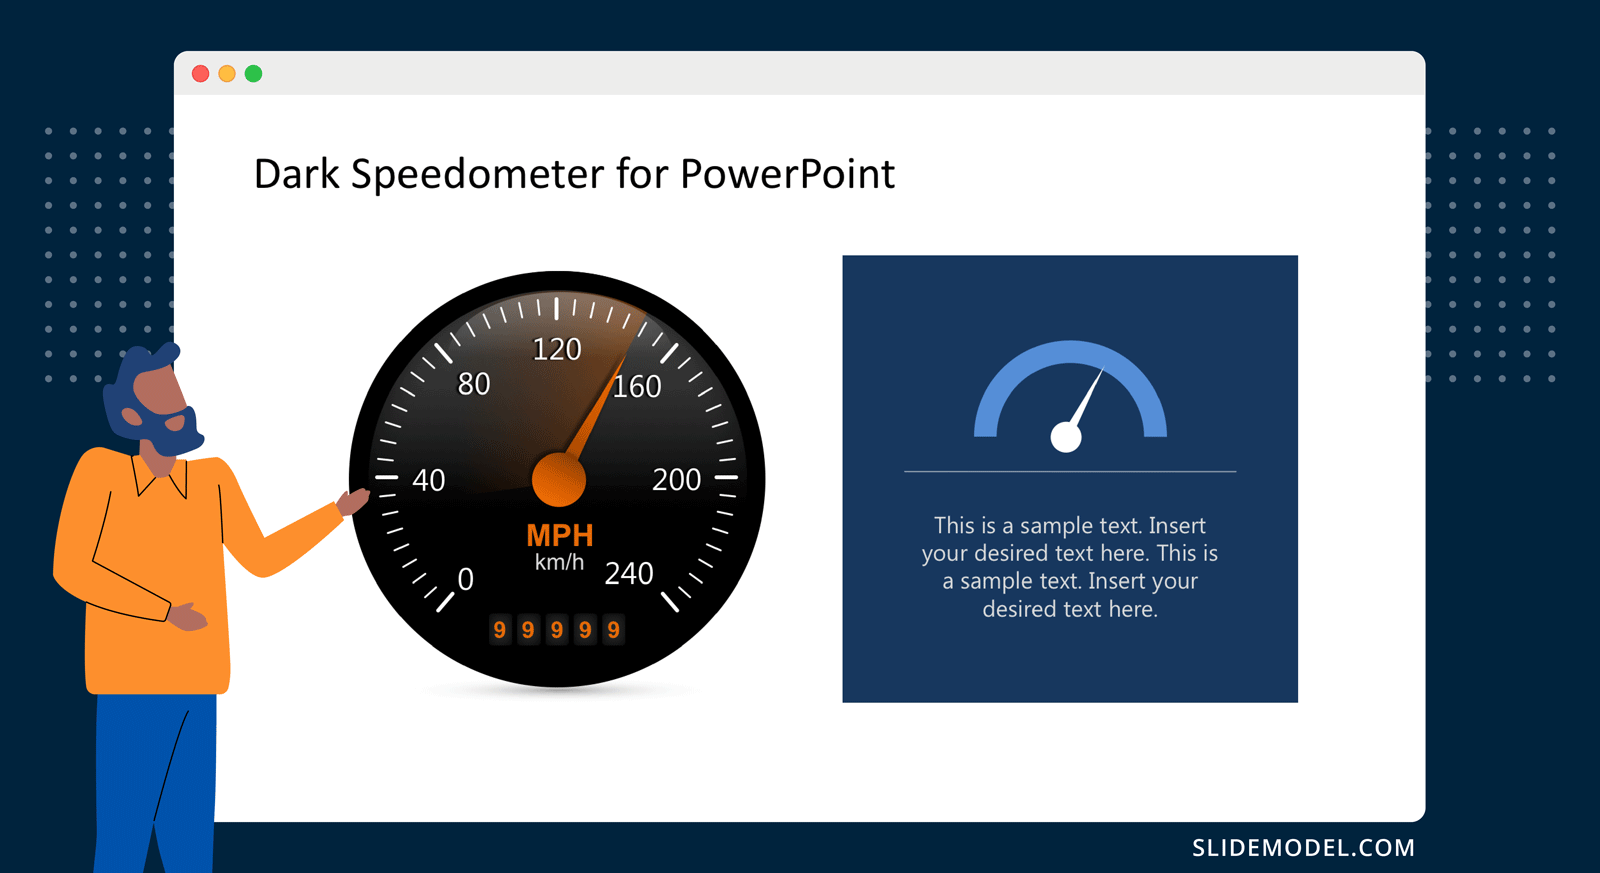
6. Speedometer Dashboard
Speedometer metaphors are great visual aids that could help your audience to understand the performance numbers at a glance. Using the editable speedometer shapes for PowerPoint you can easily make business performance PowerPoint presentations and adjust the needle to any desired position very easy in PowerPoint. Use the shape group and ungroup features in PowerPoint to isolate the speedometer from the needle and then rotate the needle to the desired direction.
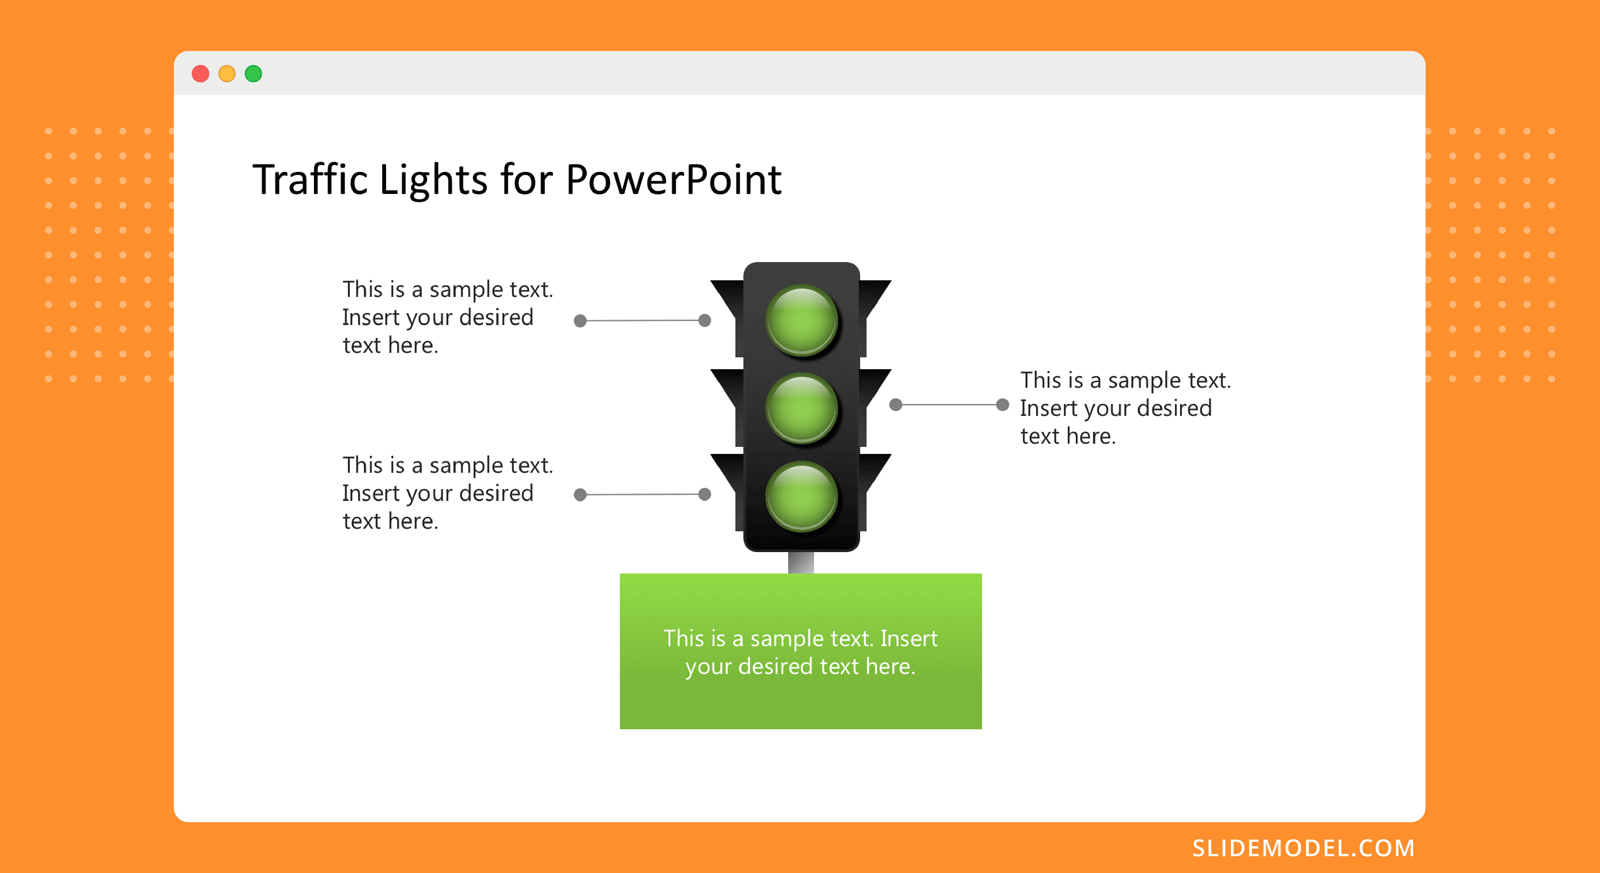
7. Free Traffic Lights & Shapes for PowerPoint
Traffic light metaphors can be used in virtually any presentations related to decision-making, innovation, leadership presentations but also coaching or creativity presentations. This free traffic lights PowerPoint template includes traffic light shapes with the three possible colors (green, yellow and red). In decision-making presentations, a red color could be “stop”, while the yellow color could be associated with taking a decision with caution while the green color means “go ahead”.
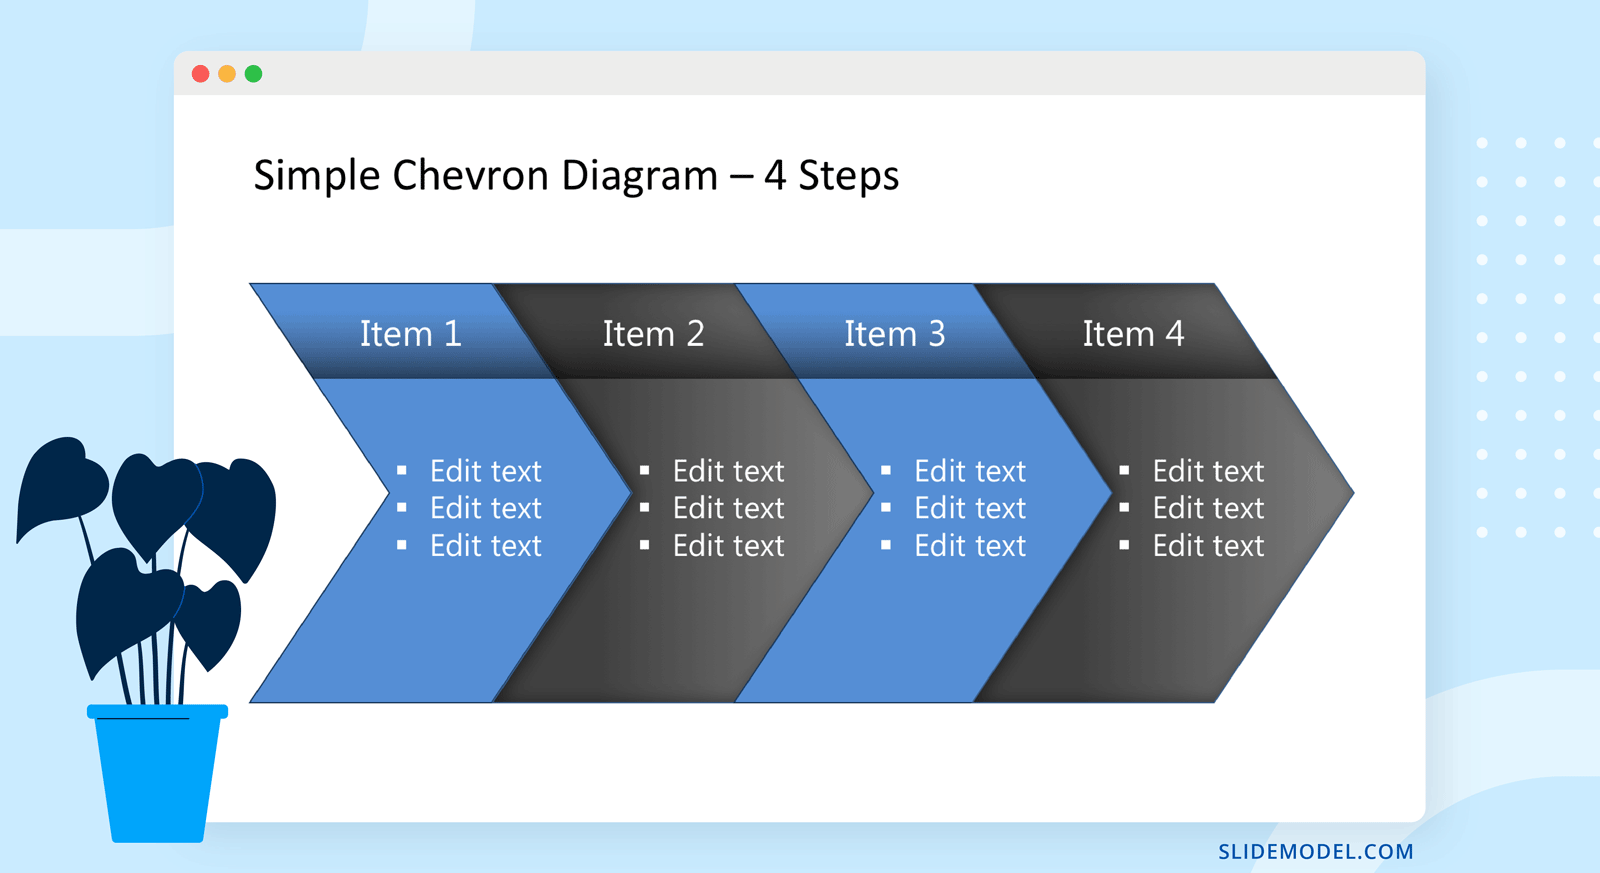
8. Simple Chevron Diagram Slides for PowerPoint
A chevron diagram illustrates the progression of sequential steps in a process, workflow or task helping to emphasize the desired direction (i.e.: from the left to the right). PowerPoint let you create Chevron diagrams very easy using SmartArt graphics but if you need to decorate your slides with visual appealing chevron diagrams for presentations you can download this free Chevron Diagram slide for Microsoft PowerPoint.
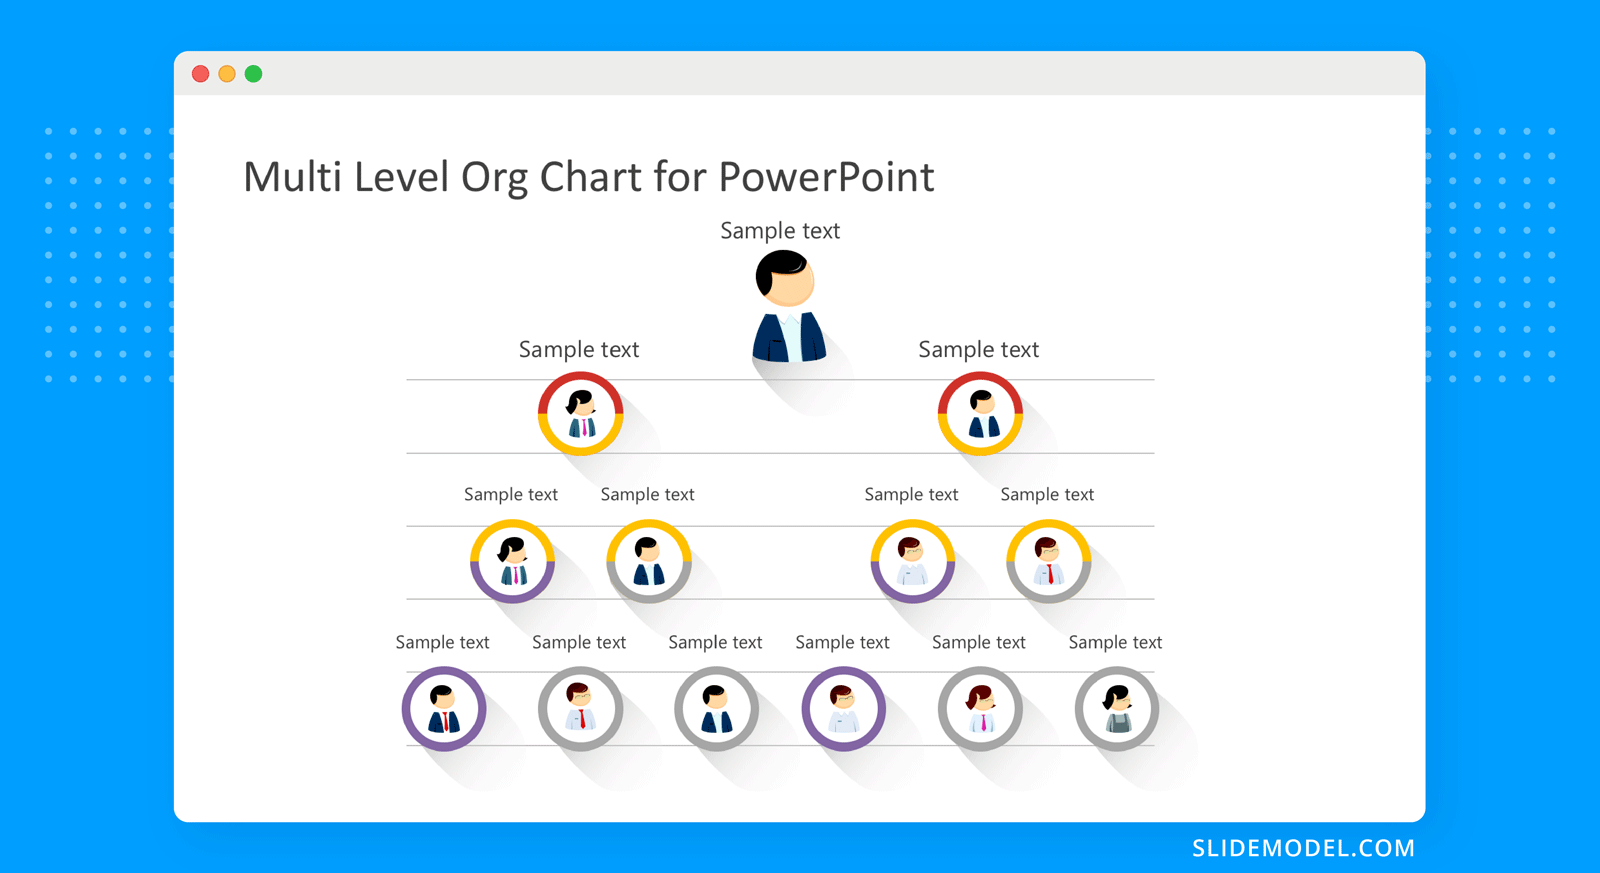
9. Free Multi-level Organizational Chart Template
Org charts diagrams help to illustration the structure of an organization and the relationship of its parts and positions. This free organizational chart design for PowerPoint contains four levels and include avatars representing the job positions. Alternatively, you can download other org chart templates for presentations with 100% editable slides.
10. All-in-One 150+ Slide Designs Mega Bundle for PowerPoint
Finally, here is the mega bundle for free download. This collection of some of the best PowerPoint slides is a very powerful resource that you can use to make presentations by reusing catchy and visually appealing business slides for PowerPoint.
The collection of PowerPoint slides inside this bundle contains creative business layouts in widescreen 16:9 aspect ratio, data-driven diagrams and PPT presentation shapes with scalable vectorial graphics that can be easily edited in Microsoft PowerPoint, but also compatible with Google Slides & Keynote. In order to download, just need to create your free account at SlideModel.com or sign in if you already have an account.
