Vertical By The Numbers PowerPoint Template
Demonstrate your research findings in the business sessions with our Vertical By The Numbers PowerPoint Template. Data is essential for understanding market trends and gaining population insights. Professionals across multiple domains use data to inform their decisions. This helps them remain calculated and avoid risky choices. For instance, customer data can help marketers address the pain points in the advertising campaigns and boost sales. Before launching a SaaS, tech, or healthcare product, data-enabled companies need to understand the demand, identify the actual problem, and launch the product based on that information. We have created this unique layout for data presentation. Marketers, analysts, researchers, and project managers can edit this template for their executive meetings.
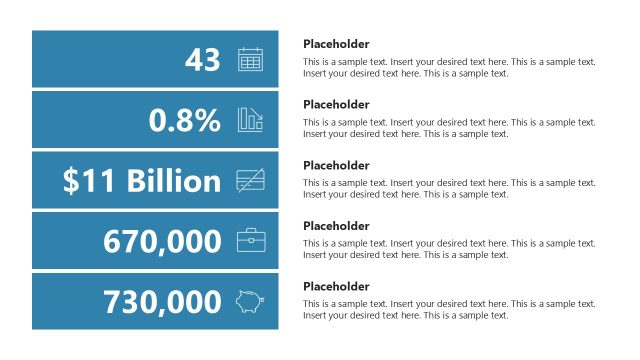
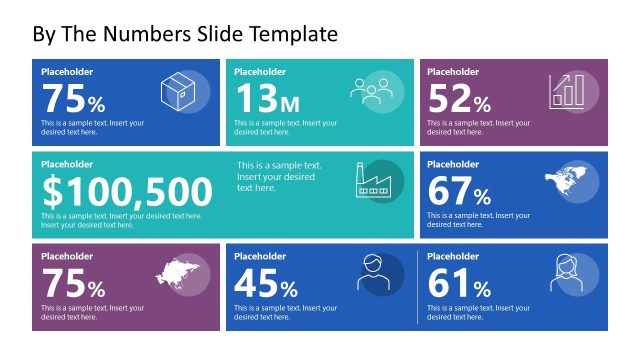
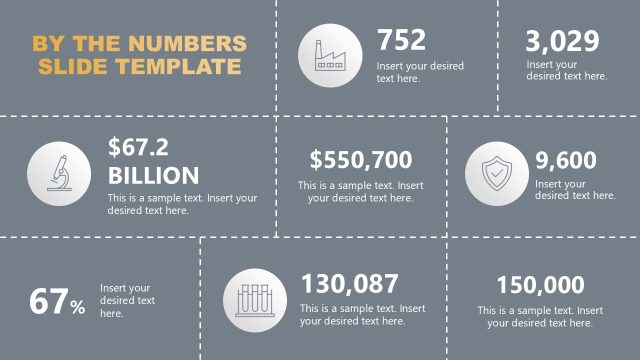
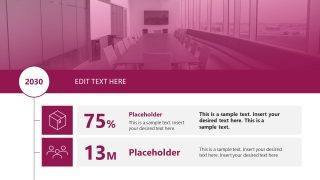
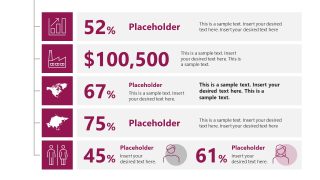
The Vertical By The Numbers PowerPoint Template features a broad cover section with a year number displayed in its corner. Next, a line emerges from it, branching several times. At each branch, there is a small block with an infographic icon or a chart icon. Then there is a long bar with each block that contains a placeholder value, a title, and description text. The second slide continues the first slide, with similar components at each branch. The placeholder text values are: 75%, 13M, 52% $100500, etc. You can edit the placeholder text to mention your corresponding details. Moreover, we have designed this layout in a vertical format to help professionals present the data comprehensively. Also, our template is compatible with Google Slides and other versions of Microsoft PowerPoint. Users can adjust the graphical arrangement and replace the icons to showcase their data effectively. Download the Verucal by the Numbers template or try our dashboard-style by the numbers template for your business presentations!


You must be logged in to download this file.
DOWNLOAD- Category
- Data & Charts
- Rating

 Loading...
- Size
- 16x9
- Item ID
- 23375-01
- Colors
Subscribe today and get immediate
access to download our PowerPoint templates.