Slide 1 of 2 from Vertical By The Numbers PowerPoint Template
Editable Vertical By The Numbers Presentation Slide
Data Overview Slide for Presentations
- Text Layout
- Other
- Context Slide
- 16:9
- 100% Editable
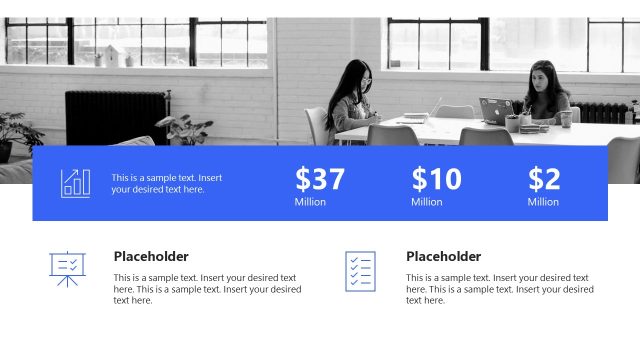
The Data Overview with Icons slide from the Vertical By The Numbers PowerPoint Template offers a clear layout for presenting key metrics and performance statistics. Designed for business presentations, this slide template includes editable shapes and vector icons to highlight data points effectively, making it suitable for pitch decks or corporate slide decks that require concise data analysis.
What’s on This Slide
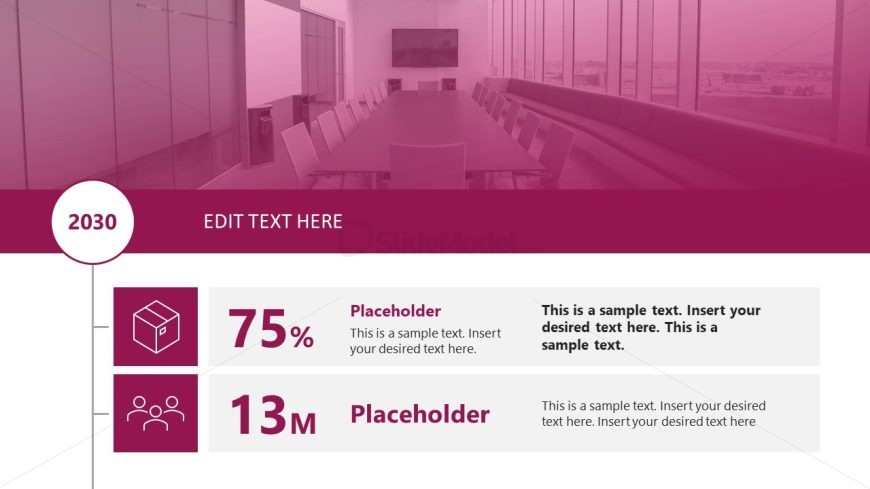
The layout features a top section with a circular node displaying the year '2030' centered above a text placeholder labeled 'EDIT TEXT HERE.' Below, two rows contain data points. The first row has a box icon on the left with the text '75%' next to it, followed by a placeholder for additional text. The second row contains a group icon on the left with '13M' next to it, also followed by a text placeholder. The overall color scheme is a gradient of pinks, with white and gray text, creating a clear visual hierarchy.
How to Use It
This layout serves as a data overview, effectively presenting key statistics or metrics. It fits well at the beginning of a presentation to introduce important figures. Suitable for business contexts, it can be used to showcase growth projections, market analysis, or performance metrics. The structure allows for easy updates and customization, making it versatile for various reporting needs.
Text Placeholders & Capacity
Keep your copy within these limits so it fits without resizing. Body slots can accommodate about 15-20 words each.
| Placeholder | Count | Max characters (approx.) |
|---|---|---|
| Slide title | 1 | 25 |
| Body paragraph | 2 | 100 |
| Item heading | 2 | 10 |
| Item body | 2 | 100 |
Slide Keywords
Download unlimited PowerPoint templates, charts and graphics for your presentations with our annual plan.
DOWNLOADReturn to Vertical By The Numbers PowerPoint Template.