Slide 2 of 2 from Vertical By The Numbers PowerPoint Template
Vertical By The Numbers Template for Business Presentation
Vertical Data Presentation Slide
- Chart
- Other
- Data Analysis Slide
- 16:9
- 100% Editable
The Vertical Data Presentation slide from the Vertical By The Numbers PowerPoint Template offers a clear vertical layout ideal for business performance metrics and financial summaries. This slide uses editable shapes and vector icons to visually enhance key data points, making it suitable for data analysis presentations and corporate slide decks that require concise and structured information display.
What’s on This Slide
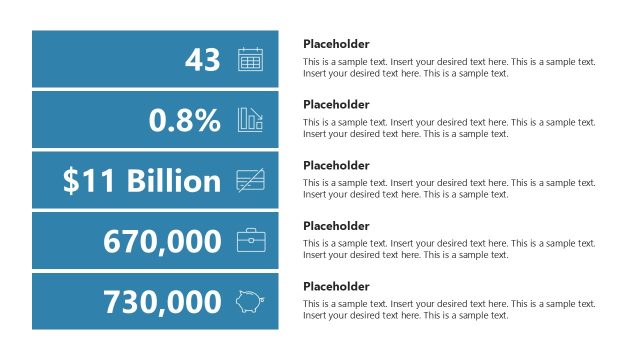
The layout features a vertical arrangement of data points, each accompanied by an icon on the left. The icons include a graph, factory, map, and people, positioned consistently to the left of their respective data. Each data point is represented by a percentage or monetary value, with placeholders for additional text aligned to the right. The overall color scheme includes a dark maroon for the icons and data labels, contrasted against a light background. The visual hierarchy emphasizes the data values, creating a clear flow from top to bottom.
How to Use It
This layout serves as a vertical data presentation, ideal for showcasing key metrics or statistics in a concise format. It fits well in a presentation sequence after an overview or introduction, effectively summarizing important figures. Suitable scenarios include business performance reports, financial summaries, or data analysis presentations. The layout allows for easy comparison of metrics, making it effective for highlighting trends or insights.
Text Placeholders & Capacity
Keep your copy within these limits so it fits without resizing. Node body slots can hold roughly 15-20 words each.
| Placeholder | Count | Max characters (approx.) |
|---|---|---|
| Item heading | 5 | 10 |
| Item body | 5 | 100 |
Slide Keywords
Download unlimited PowerPoint templates, charts and graphics for your presentations with our annual plan.
DOWNLOADReturn to Vertical By The Numbers PowerPoint Template.