3D Clustered Bar Diagram Template
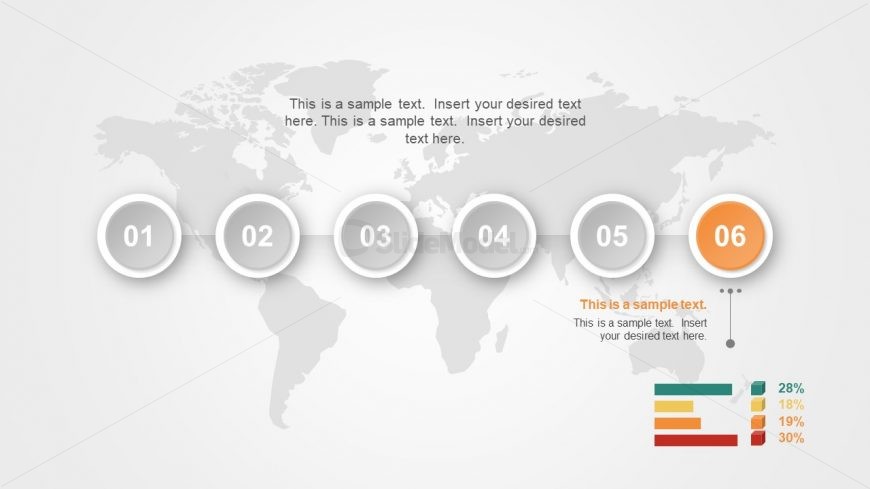
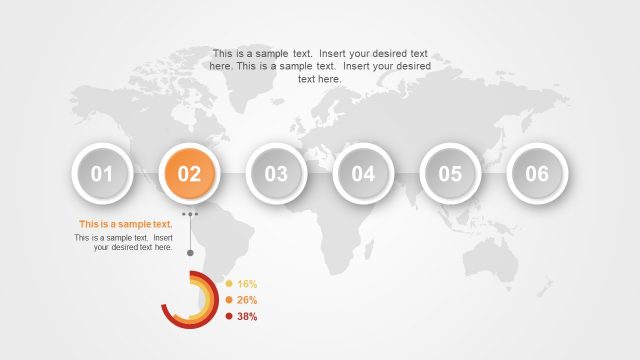
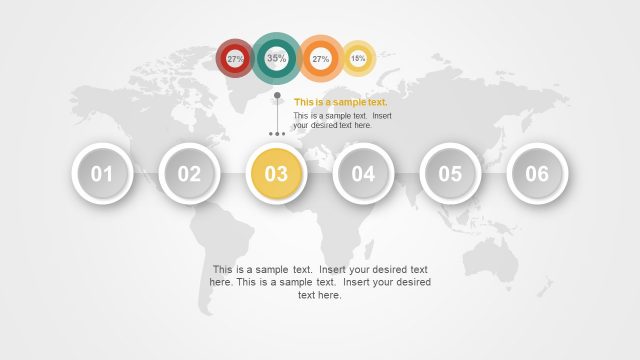
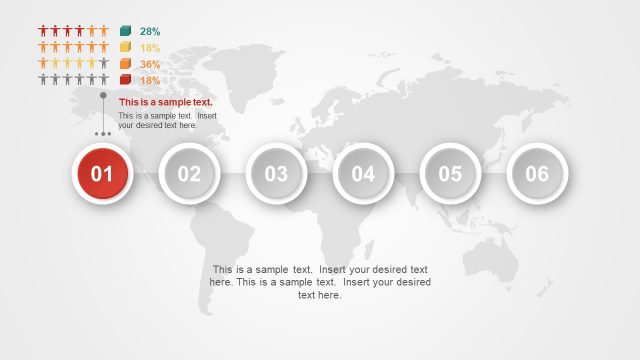
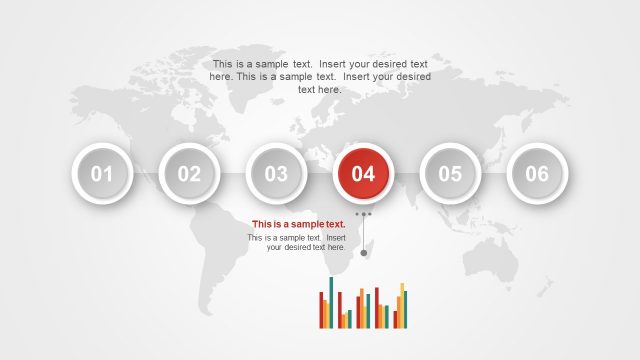
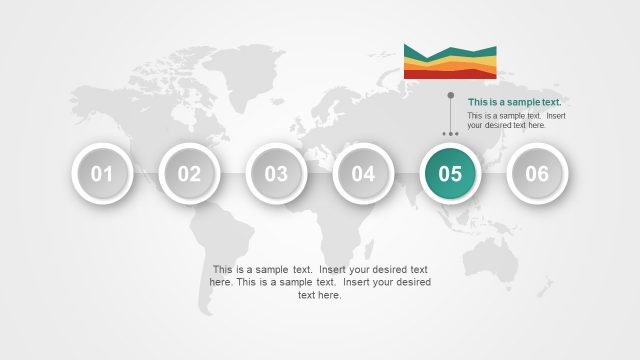
The 3D Clustered Bar Diagram Template of PowerPoint timeline of material design is a dashboard presentation. This slide of PowerPoint displays the vertical bar chart diagram with status icons and percentage. The PowerPoint graph in the 6 phase timeline of has an incredible background of world map translucent image. The template diagram is editable and users can modify design by clicking the plus symbol button Whereas, to update data, click funnel symbol to add data elements and increase or decrease the number of bars. This slide is also an animated PowerPoint for an outstanding visual effect for the viewers.
Return to Timeline Template Material PowerPoint.