PowerPoint Timeline Graphics Analysis
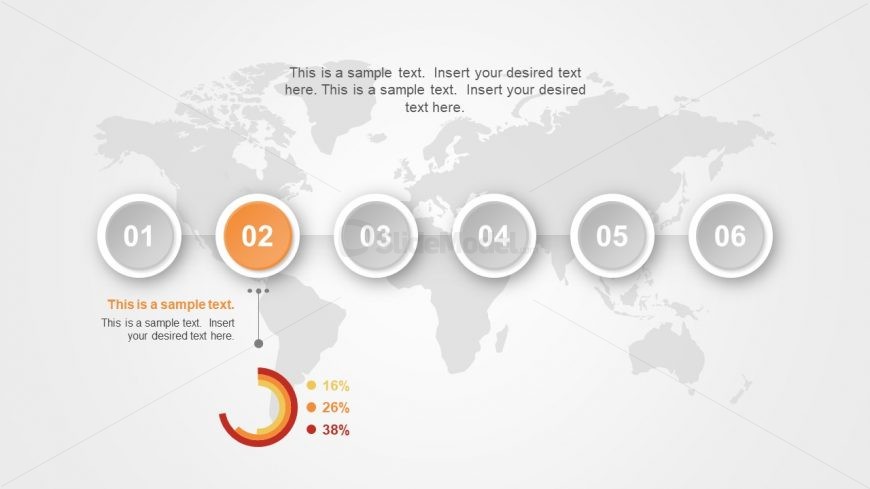
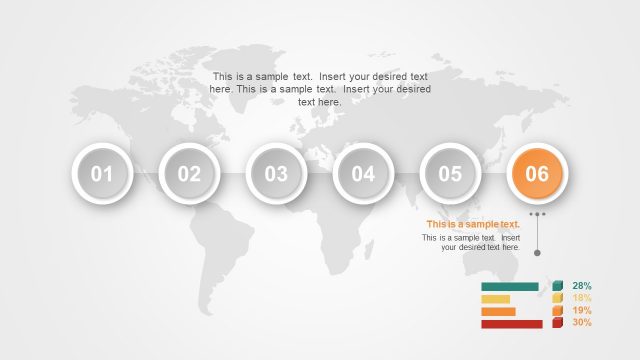
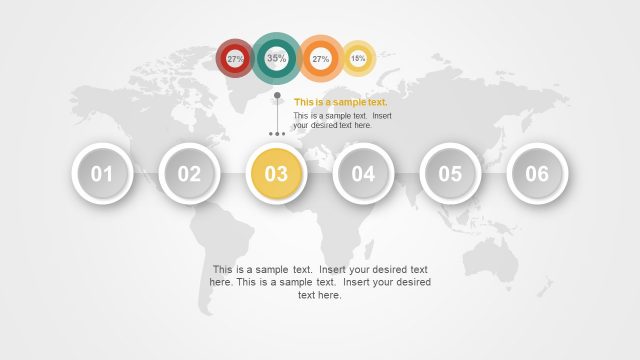
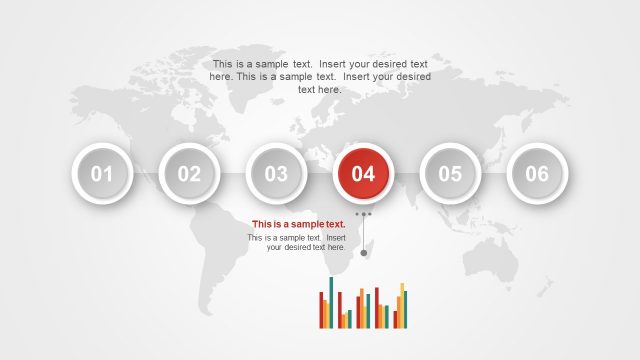
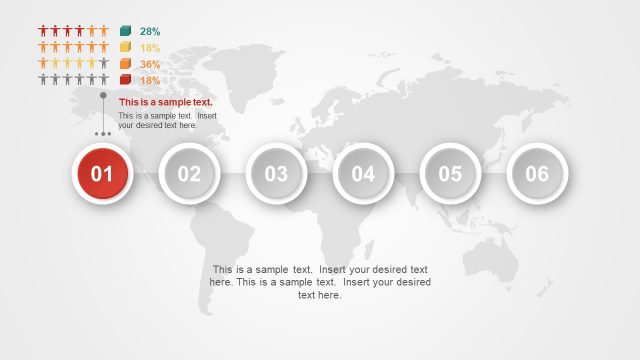
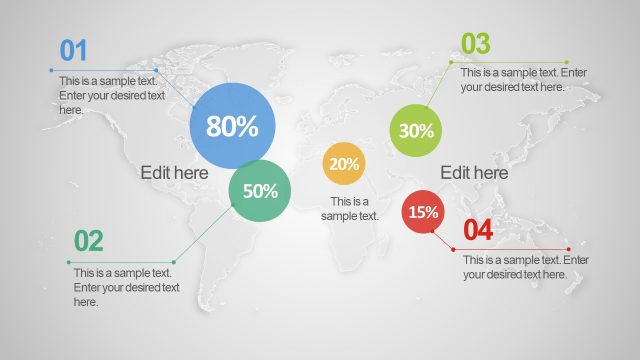
This PowerPoint Timeline Graphics Analysis is a business plan presentation with useful diagrams at each phase. The circular chart of PowerPoint here is a data driven diagram of three entities. The presenter can make changes in the chart to increase or decrease the bars. Similarly, they ca update the data and alter the status of chart. This schedule management PowerPoint has animation and transitions applied to slides and its objects. Such animations make the template visually interactive, the smooth effects can help the audience to get comfortable. Also, these effects are helpful in getting maximum audience engagement.
Alternatively, you can download other timeline slides for presentations or learn how to make your own timelines in PowerPoint or Google Slides.
Return to Timeline Template Material PowerPoint.