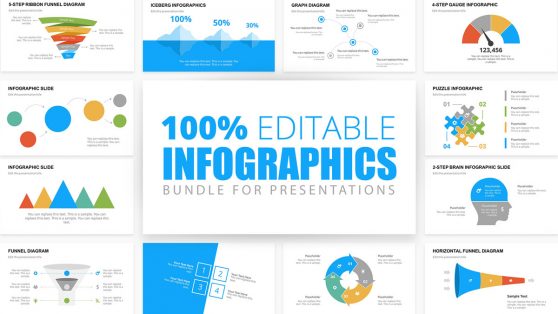
217+ Infographics PowerPoint Templates & Slides for Presentations
Presentations using infographics PowerPoint templates are a good option for capturing audience attention when explaining complex data. It is an easy to understand representation of data. The Business Infographics templates are the most popular among this category. In this category, you can download 100% editable infographic templates for presentations in PowerPoint and Google Slides.
Featured Templates
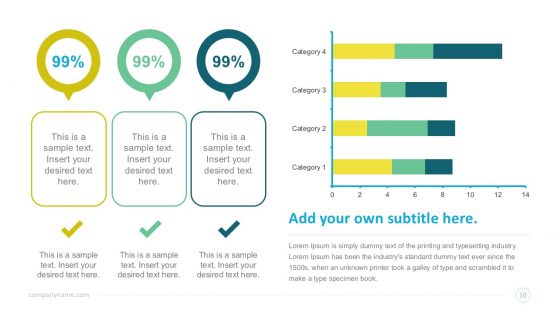
Infographic PowerPoint
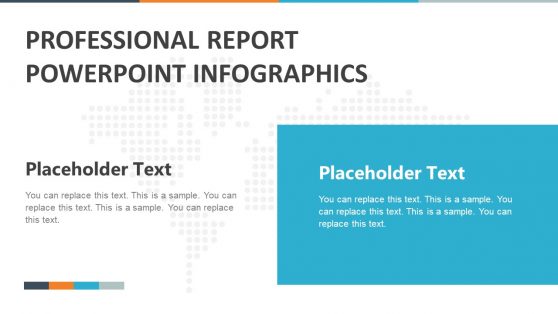
Professional Report Infographics PowerPoint Template
Infographic Dashboard Elements PowerPoint Template
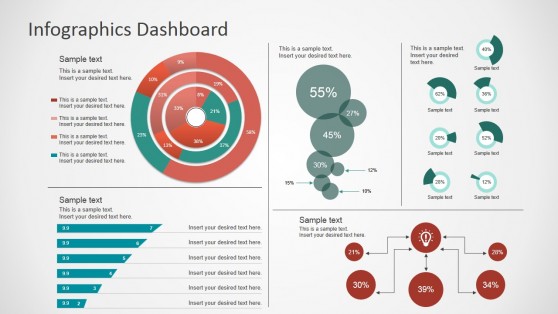
Simple Infographics Dashboard for PowerPoint
Latest Templates

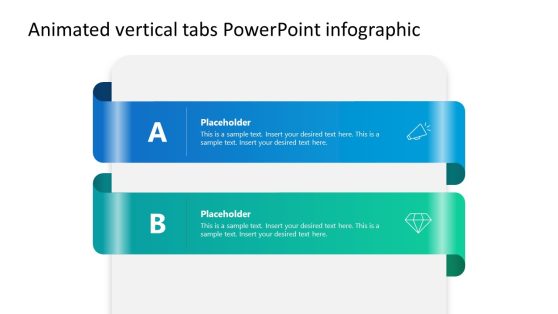
Animated Vertical Tabs PowerPoint Infographic
These infographic presentation slide templates have high demand within educational presentations and business presentations. In the first audience, because infographics have a good effect in learning; students retain more information transmitted through visual slides. In the latter audience, infographics have popularity for presenting statistics and KPI’s for executive summaries.
For creating statistical analysis on PowerPoint, Infographics PowerPoint Slides Templates play an important role. Whenever you will be using Infographics PowerPoint templates, it will help you present the key facts in your presentation to give your audience a chance to determine your idea.
The Infographics PowerPoint Templates Tag is a collection of Presentation templates created with the purpose of showcasing information though the use of illustrations and graphics. You will find a wide range of templates with different structured:
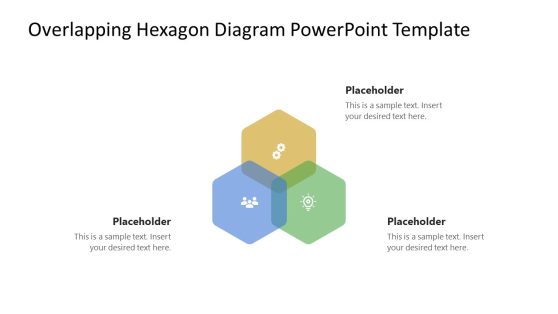
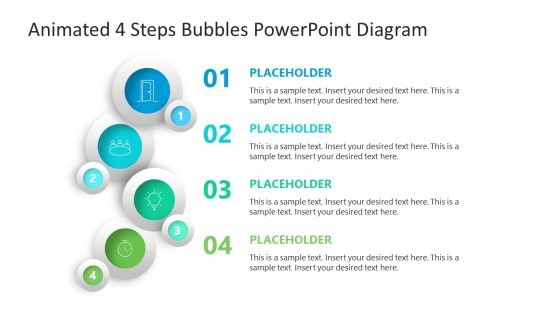
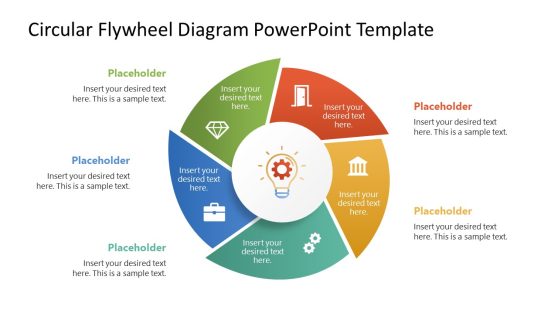
- Diagram based: this means that the core of the template is a diagram which can be edited to show different amounts of values (data) in a visual way. It is also used to show differences in a process.
- Iconographic based: These templates use a set of icons representing a metaphor and some coloring feature provide the value. For example when you use a male or female icon and use a color code to represent a value.
- Dashboard based: These templates display in a single visualization, several charts which are contextualized through the use of scenes or icons.
Exploring the PowerPoint infographics in the category, is a suitable practice to find several elements to use in your presentation. In general, users do no use only one infographics for PPT presentations, they combine several elements of different templates to create their visual.
What Are Infographics ?
By definition, an Infographic is the use of images, icons and illustrations to represent data. The term is short for “information graphics”. Its use has become very popular in the last decade due to the evidence that the general audience is a visual learner. People are more prone to understand and retain a message based on data, if it is transmitted through infographics.
What are Infographics PowerPoint Templates?
Infographics PowerPoint templates are editable infographics created in PowerPoint with placeholder features. It typically uses multiple components to capture values of data. Starting from related shapes and diagrams to attention-getting flowcharts, timelines, graphs, images, etc. Selecting an engaging combination and fonts is additionally essential to make an efficient Infographics template. It will contain informative statistics, a successive story, and maybe clearly organized.
How Can Infographics PowerPoint Templates Be Used In Presentations?
The process of using an infographic template in your presentations is slightly different than the one of a traditional presentation.
First, you need to review the data you want to present and classify it according to the message it needs to transmit
- Comparison
- Distribution
- Composition
- Relationship
Secondly, you need to find in the gallery, the metaphor that better contextualizes the data points. For example, if you want to show demographics based on a survey, and want to express the Comparison between male or female, you will use male and female icons. On the other hand, if you want to express the comparison between some data point of people in the US versus Canada, you will use a map. But if you want to show information about a hierarchy relationship, probably you will use a Pyramid diagram or Org chart template.
Finally, you will define the feature that will make the category show up and describe the value of the data point. Based on the previous example, to show percentage of male or female people, we can color the icons area based on the percentage number. For the Maps metaphor we can use Size, making the map bigger or smaller, in a proportional way based on the data point. Based on the category, you will chose the visual slide that better represent the category.
How Can Infographics Be Used in Google Slides Presentations?
Our 100% editable Infographic slides are compatible with Google Slides. You can browse the collection of engaging infographics template designs in our catalog and use any infographic in Google Slides. Learn how to Open templates in Google Slides using the Open in Google Slides button available at SlideModel.