Slide 3 of 4 from Supply & Demand Curve for PowerPoint
6072-02-concept-supply-demand-curves-3
Economic Supply Curve for PowerPoint
- Chart
- Line Chart
- Concept Explanation Slide
- 16:9
- 100% Editable
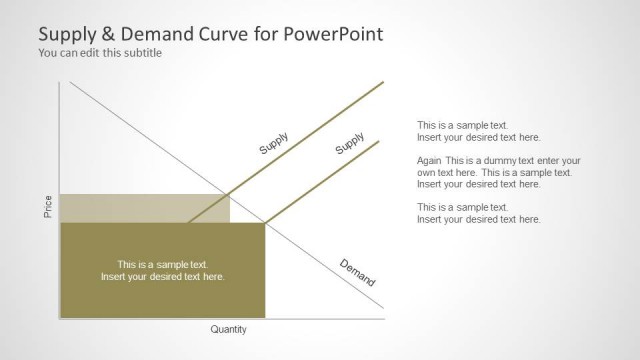
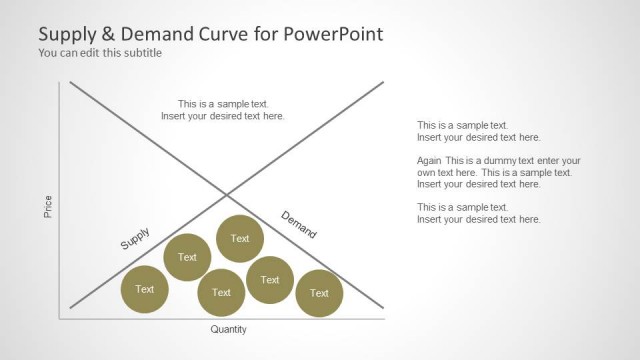
The Economic Supply Curve slide from the Supply & Demand Curve for PowerPoint template presents a clear line chart illustrating price and quantity relationships. This slide layout is ideal for economic analysis and pricing strategy discussions within business presentations or pitch decks, featuring editable shapes and vector icons for customization. It supports clear communication of market dynamics in corporate presentations using professional PowerPoint templates and Google Slides templates.
What’s on This Slide
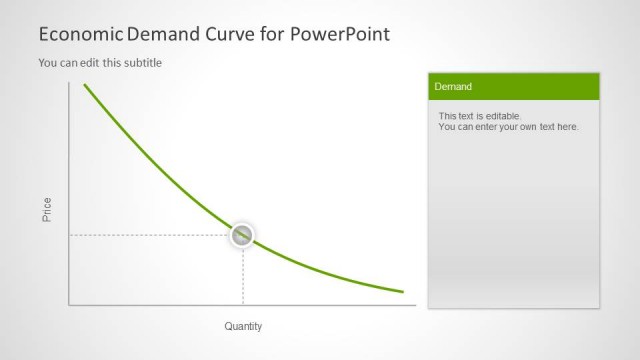
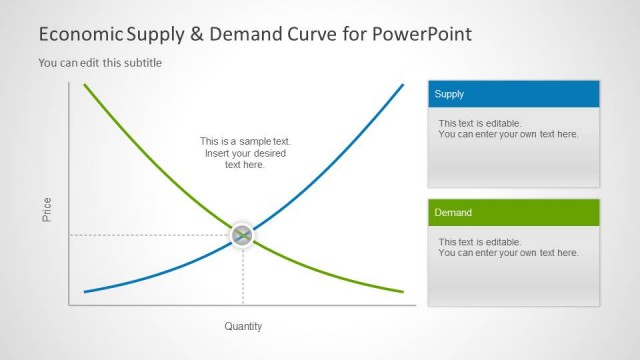
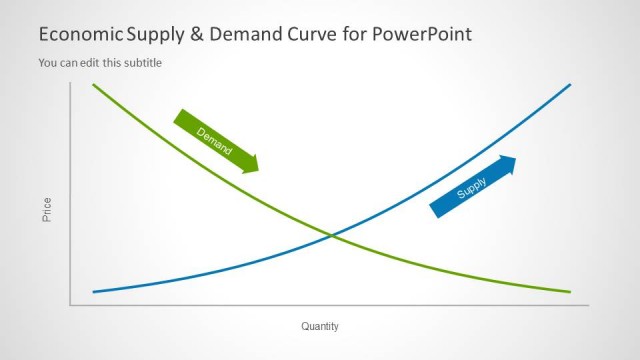
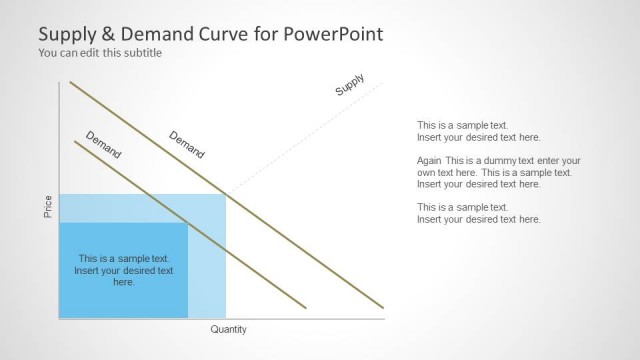
The layout features a supply curve chart positioned on the left side, with the x-axis labeled 'Quantity' and the y-axis labeled 'Price.' The curve is a smooth line rising from the lower left to the upper right. A circular node is placed on the curve, indicating a specific point. On the right, there is a rectangular text box titled 'Supply,' containing editable placeholder text. The overall composition is balanced, with the chart and text box clearly separated, allowing for easy readability and data presentation.
How to Use It
This layout serves to illustrate the economic supply curve, making it suitable for discussions on market dynamics or pricing strategies. It fits well in a presentation sequence following introductory slides on supply and demand concepts. This format is useful in business contexts such as economic analysis, financial presentations, or educational settings where economic principles are explained. It effectively conveys relationships between price and quantity supplied.
Text Placeholders & Capacity
Keep your copy within these limits so it fits without resizing. Node body slots can hold roughly 15-20 words each.
| Placeholder | Count | Max characters (approx.) |
|---|---|---|
| Slide title | 1 | 40 |
| Subtitle | 1 | 60 |
| Item heading | 1 | 20 |
| Item body | 1 | 100 |
Slide Keywords
Download unlimited PowerPoint templates, charts and graphics for your presentations with our annual plan.
DOWNLOADReturn to Supply & Demand Curve for PowerPoint.