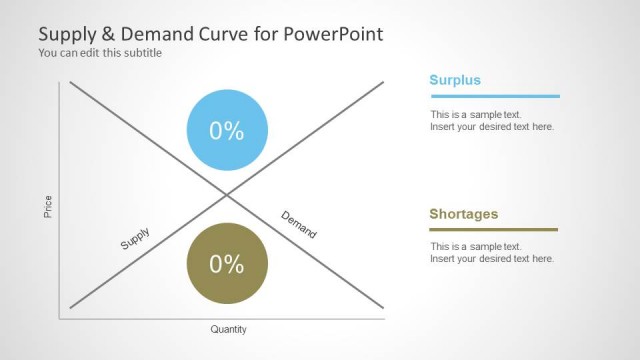
Supply & Demand Curve for PowerPoint– Supply and Demand law states that the two variables are inversely proportional. This means that when the Supply is high, the Demand is low, and otherwise. This simple yet practical PowerPoint template can present the economic model perfectly.
The model is composed of the supply curve, demand curve and the point where the variables meet which is considered as the equilibrium. Supply curve is a symbolic representation of the relationship between price of goods and its available supply. Demand curve illustrates the relationship of the amount of goods people are willing and able to purchase and the price, considering that all other factors remain constant. These factors or determinants are Income, Preferences, Prices of related goods and services, Consumer’s expectation and Number of potential customers. On the other hand, equilibrium means there is a balanced quantity for both demand and supply.
The slide designs are especially modified to fit economic price determination for the market. This can be done thru plotting the supply and demand curve in an overlapping graph like the one in the PowerPoint template.
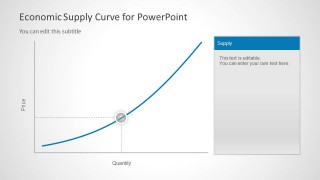
In the first slide, the layout displays both demand curve and supply curve. Arrows with Demand and Supply terms are displayed in corresponding colors to the curves. In the second slide, the presenter is given a chance to elaborate on the text placeholders found at the right side of the layout. A detailed account of each variable can be highlighted on the 3rd and 4th slides. The third slide gives a venue for explanation about the supply schedule or curve. The fourth slide does the same with the demand curve variable.
Smart up presentations with the professional feel of Supply & Demand Curve for PowerPoint. Supply & Demand Equilibrium for PowerPoint is downloadable at the SlideModel gallery.
What’s inside this template
Example presentation scenarios
- An economics instructor can use the combined supply and demand curve to introduce the inverse relationship between quantity demanded, quantity supplied, and price.
- A pricing analyst can use the equilibrium point layout to explain how a proposed price aligns with expected market demand and available supply.
- A product manager can use the separate supply curve slide to discuss production capacity, availability, and market constraints during a product planning meeting.
- A retail planner can use the demand curve slide to present how customer willingness to buy may change as price changes.
Features
- 100% editable presentation template
- Compatible with Microsoft PowerPoint and Google Slides
- Scalable vector shapes, icons and illustrations
- AI-Ready for Microsoft Copilot and Claude
- Instant access and download
Frequently asked questions
Q: How should a presenter explain the model without overloading the audience?
A: Start with Slide 1 to establish that the blue supply curve rises while the green demand curve falls. Then use Slide 2 to focus attention on the highlighted intersection before discussing causes. Keep the right-side text panels short, using them for definitions or implications rather than full paragraphs.
Q: Who is this template best suited for in a business presentation?
A: This template works best for presenters who need to explain pricing behavior, product availability, or market response in a clear economic model. It fits analysts, product managers, retail planners, and educators who want to show a concept visually before discussing assumptions, price decisions, or demand drivers.
Q: Why does the template use crossing curves and a highlighted point marker?
A: The crossing curves create an immediate visual metaphor for opposing market forces: supply rising with price and demand falling with price. The highlighted marker and dashed guides direct the audience to the equilibrium point, turning an abstract economics concept into a precise location on the price and quantity axes.



Supply & Demand Curve for PowerPoint
4-slide presentation template for supply and demand curves, equilibrium points, and price quantity axes
This 4-slide PowerPoint template shows economic supply and demand relationships through editable curve diagrams. It includes a combined supply demand curve, an equilibrium point layout with side text panels, and separate supply curve and demand curve explanation slides for economics, market research, pricing, retail, and product planning presentations.


 Loading...
 Microsoft PowerPoint
 Microsoft Copilot
 Claude for PowerPoint
Other formats supported
Subscribe today and get immediate
access to download our PowerPoint templates.