Slide 11 of 13 from Stratum Business PowerPoint Template
Financial Outlook Slide with Area Plot
Financial Outlook Chart for Business Presentation
- Chart
- Line Chart
- Financial Summary Slide
- 16:9
- 100% Editable
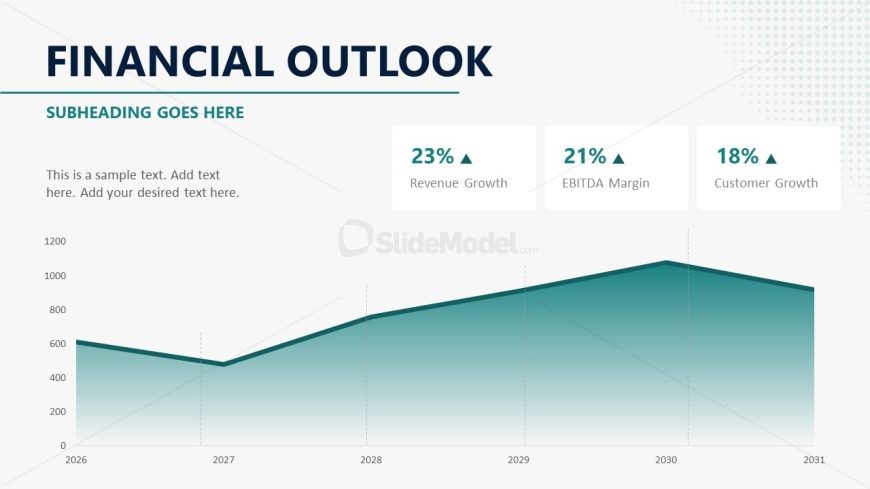
The Financial Outlook Chart slide from the Stratum Business PowerPoint Template offers a clear visual summary of key financial metrics using editable slides and vector icons. Designed for business presentations and investment pitches, this layout features a line chart highlighting revenue growth, EBITDA margin, and customer growth trends, making it a practical choice for corporate presentation slide decks focused on financial performance review.
What’s on This Slide
The layout features a large title at the top left, stating 'FINANCIAL OUTLOOK' in bold. Below, a smaller subtitle placeholder is positioned, labeled 'SUBHEADING GOES HERE.' A line chart occupies the center, displaying a financial trend from 2026 to 2031 with a gradient fill. Three data callouts are placed to the right of the chart, each showing a percentage and a label: 'Revenue Growth,' 'EBITDA Margin,' and 'Customer Growth.' Text placeholders are present for additional details below the chart, aligned left. The overall color scheme includes shades of teal and white.
How to Use It
This layout serves as a financial overview, showcasing key metrics and trends over time. It is suitable for presentations that require a clear visual representation of financial performance, such as quarterly reports or strategic planning sessions. Positioned after problem identification slides, it effectively transitions into discussions about future projections. This format is ideal for business scenarios where financial data needs to be communicated succinctly and visually.
Text Placeholders & Capacity
Keep your copy within these limits so it fits without resizing. Body slots are tight, roughly 15 words each.
| Placeholder | Count | Max characters (approx.) |
|---|---|---|
| Slide title | 1 | 30 |
| Subtitle | 1 | 40 |
| Body paragraph | 1 | 100 |
| Item heading | 3 | 20 |
| Item body | 3 | 20 |
Slide Keywords
Download unlimited PowerPoint templates, charts and graphics for your presentations with our annual plan.
DOWNLOADReturn to Stratum Business PowerPoint Template.