Slide 12 of 14 from Business Development PowerPoint Template
Financial Projections Business Development Template
Financial Projections for Business Development
- Chart
- Line Chart
- Financial Summary Slide
- 16:9
- 100% Editable
The Financial Projections Chart slide from the Business Development PowerPoint Template offers a clear visualization of financial forecasts using editable slides with vector icons. This layout is suited for business presentations and pitch deck templates focused on illustrating growth trends and investment potential through detailed line charts.
What’s on This Slide
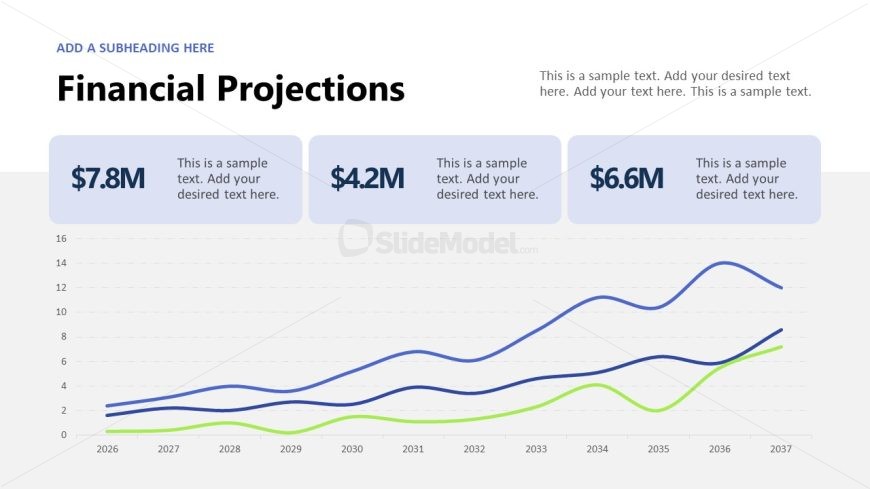
The slide features a financial projections chart positioned centrally. It includes three distinct data series represented by blue and green lines, indicating growth over time. The x-axis displays years from 2026 to 2037, while the y-axis indicates financial values, likely in millions. Above the chart, there are three text placeholders for financial figures, aligned horizontally. A prominent title is placed at the top left, with a subheading above it. The background is light gray, enhancing the visibility of the chart and text elements.
How to Use It
This layout serves as a financial projections chart, ideal for illustrating revenue growth or financial forecasts in a business presentation. It fits well after problem framing or market analysis slides, providing a visual representation of expected financial outcomes. This structure is useful for stakeholders to understand potential growth trajectories and make informed decisions based on projected data.
Text Placeholders & Capacity
Keep your copy within these limits so it fits without resizing. Text slots can accommodate concise entries, with body slots holding roughly 15-20 words each.
| Placeholder | Count | Max characters (approx.) |
|---|---|---|
| Slide title | 1 | 30 |
| Subtitle | 1 | 50 |
| Item heading | 3 | 10 |
| Body paragraph | 3 | 100 |
Slide Keywords
Download unlimited PowerPoint templates, charts and graphics for your presentations with our annual plan.
DOWNLOADReturn to Business Development PowerPoint Template.