Slide 6 of 17 from M&A PowerPoint Template
Financial Overview with Revenue Bar Chart
Financial Overview for M&A Presentation
- Chart
- Bar Vertical
- Financial Summary Slide
- 16:9
- 100% Editable
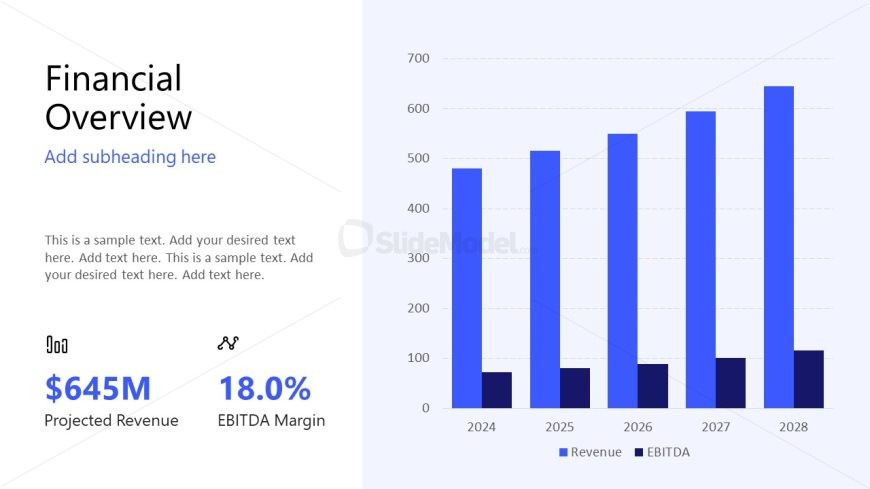
The Financial Overview Chart slide from the M&A PowerPoint Template offers a clear vertical bar chart layout ideal for presenting financial projections and investment summaries. This slide integrates editable shapes and vector icons to visually communicate projected revenue and EBITDA margins from 2024 to 2028, making it suitable for corporate presentations and business presentation decks focused on financial performance and strategic planning.
What’s on This Slide
The layout features a vertical bar chart on the right side, displaying projected revenue and EBITDA margins for the years 2024 to 2028. The chart has five bars, each representing a year, with blue shades indicating revenue. To the left, there is a title at the top, followed by a subtitle placeholder. Below, two text placeholders present key financial figures: projected revenue of $645M and an EBITDA margin of 18.0%. The overall composition balances text and visuals, with a light background enhancing readability.
How to Use It
This layout serves as a financial overview, ideal for presenting key metrics in a merger and acquisition context. It fits well after introductory slides, providing a clear snapshot of financial projections. This structure is useful for stakeholders assessing financial health, comparing projected growth, or discussing investment opportunities. It can be employed in quarterly reviews or strategic planning sessions to highlight financial expectations and performance metrics.
Text Placeholders & Capacity
Keep your copy within these limits so it fits without resizing. Body slots can hold about 15-20 words each, with tight spacing.
| Placeholder | Count | Max characters (approx.) |
|---|---|---|
| Slide title | 1 | 30 |
| Subtitle | 1 | 50 |
| Body paragraph | 3 | 100 |
| Kpi value | 2 | 10 |
| Kpi caption | 2 | 20 |
Slide Keywords
Download unlimited PowerPoint templates, charts and graphics for your presentations with our annual plan.
DOWNLOADReturn to M&A PowerPoint Template.