Slide 8 of 13 from Creative Company Presentation Template
Line Graph Financial Presentation Slide
Financial Chart Slide for Presentations
- Chart
- Line Chart
- Financial Summary Slide
- 16:9
- 100% Editable
What’s on This Slide
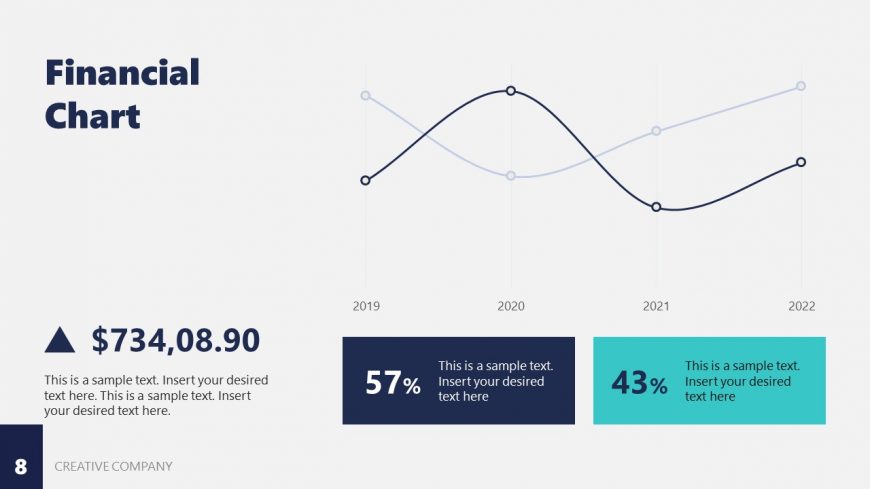
The slide features a financial chart positioned centrally, displaying two lines representing data over the years 2019 to 2022. The chart includes data points connected by smooth lines, with vertical grid lines for clarity. To the left, a large dollar amount is displayed prominently, accompanied by an upward arrow icon. Below the chart, two rectangular text boxes are aligned horizontally, each containing percentage values and sample text placeholders. The background is a light color, enhancing the visibility of the dark text and icons.
How to Use It
This layout serves as a financial overview, ideal for presenting key metrics and trends in a business context. It fits well after problem identification slides, providing a visual representation of financial performance. Use this slide to summarize financial data in pitch decks, capability statements, or company profiles, where clear visualization of financial trends is essential for decision-making and stakeholder engagement.
Text Placeholders & Capacity
Keep your copy within these limits so it fits without resizing. Body slots can accommodate about 15-20 words each.
| Placeholder | Count | Max characters (approx.) |
|---|---|---|
| Slide title | 1 | 20 |
| Body paragraph | 3 | 100 |
| Item heading | 2 | 10 |
| Kpi value | 1 | 10 |
Slide Keywords
Download unlimited PowerPoint templates, charts and graphics for your presentations with our annual plan.
DOWNLOADReturn to Creative Company Presentation Template.


