Slide 2 of 2 from Store Dashboard PowerPoint Template
Store Dashboard Template Slide
Store Performance Dashboard Overview
- Chart
- Dashboard Composite
- Context Slide
- 16:9
- 100% Editable
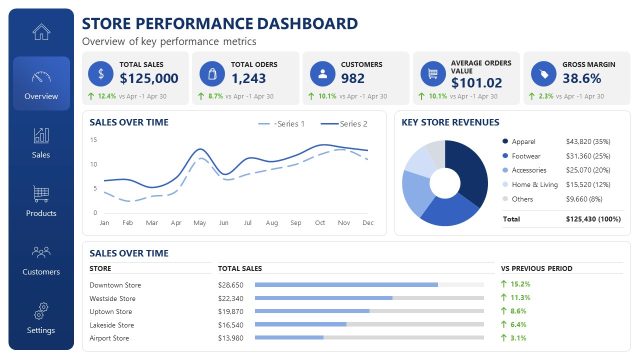
The Store Performance Dashboard slide from the Store Dashboard PowerPoint Template offers a detailed view of sales metrics, combining charts and tables to support business presentations focused on e-commerce insights and store comparison analysis. This slide layout includes editable shapes and vector icons to clearly display key performance indicators, making it suitable for corporate presentations and pitch deck templates that require a comprehensive sales performance review.
What’s on This Slide
The layout features a dark blue background with multiple sections. The top section displays key performance metrics, including total sales, total orders, customers, average order value, and gross margin, each in rounded rectangles with icons. Below, a line chart illustrates sales over time, with two series represented. To the right, a pie chart shows key store revenues by category. A table lists sales over time for different stores, with horizontal bars indicating total sales. Text placeholders exist for titles and metrics, aligned centrally and left.
How to Use It
This layout serves as a performance dashboard, ideal for presenting sales data and key metrics. It fits well after introductory slides, providing a comprehensive overview of store performance. Use this structure in business meetings to summarize sales trends, compare store performances, or analyze revenue distribution. It is effective for stakeholders needing insights into e-commerce performance and operational metrics.
Text Placeholders & Capacity
Keep your copy within these limits so it fits without resizing. Body slots can accommodate roughly 5-8 words each.
| Placeholder | Count | Max characters (approx.) |
|---|---|---|
| Slide title | 1 | 30 |
| Body paragraph | 5 | 50 |
| Item heading | 5 | 20 |
| Item body | 5 | 30 |
Slide Keywords
Download unlimited PowerPoint templates, charts and graphics for your presentations with our annual plan.
DOWNLOADReturn to Store Dashboard PowerPoint Template.