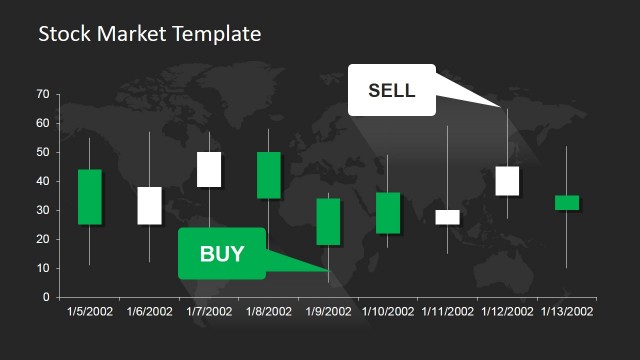
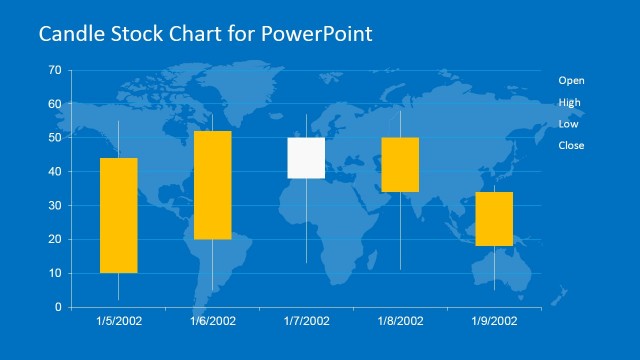
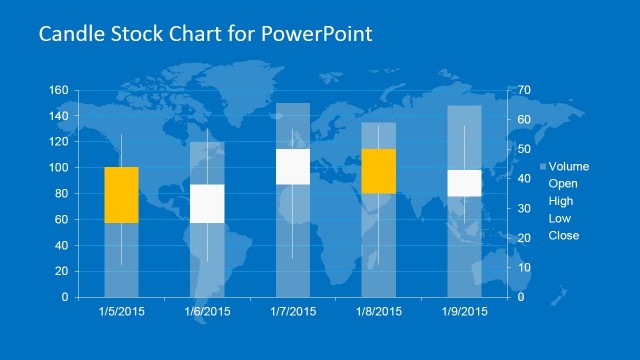
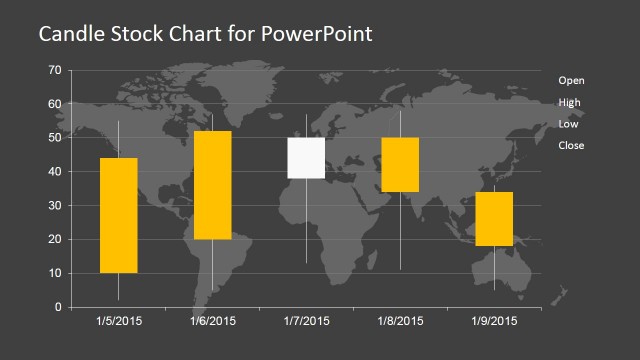
Candlestick Chart with Labels Globes
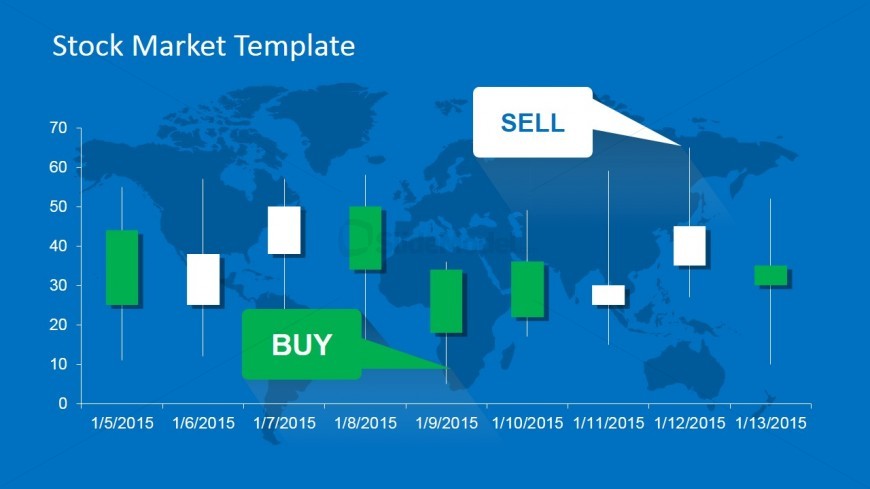
This PowerPoint Template displays the standard candlestick chart with a series of nine green and white candlesticks. These candlesticks are set in a blue background with “buy” and “sell” labels, truly an appealing way of visualizing price trends. The user of this PowerPoint slide will be able to show the patterns of the market – whether it is “bullish” or “bearish” then be able to advise the audience whether to buy or to sell stocks based on the price movement reflected in the candlestick chart. Additional information may likewise be inserted depending on the need or on the preference of the presenter. The Candlestick chart is created as a data driven PowerPoint chart. Users can alter the data using Excel data directly in the spreadsheet format.
Return to Stock Market PowerPoint Template.