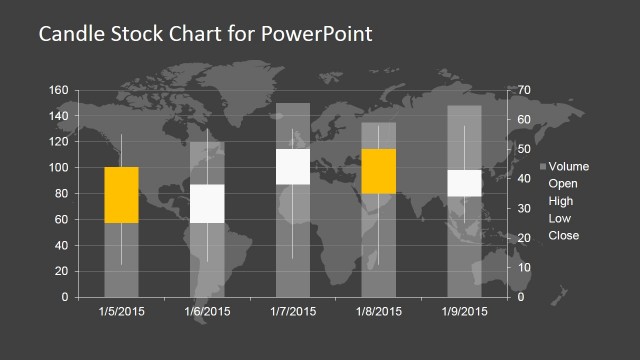
Candle Chart for PowerPoint Dark Background
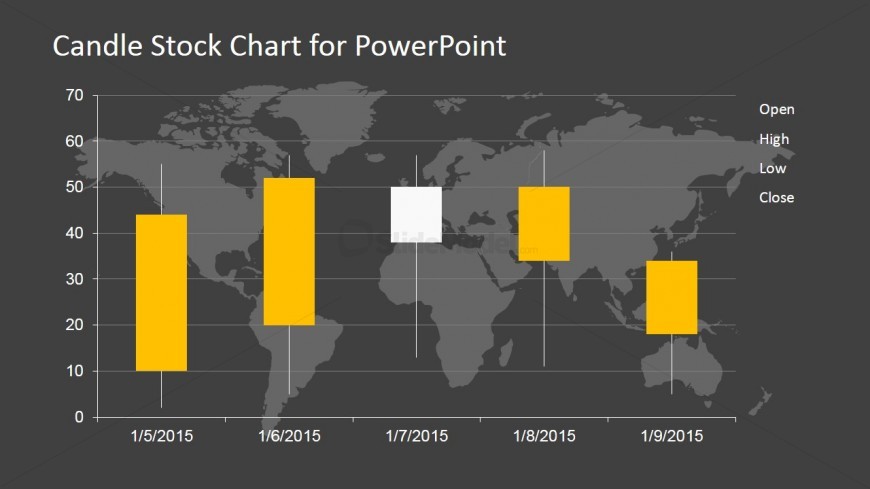
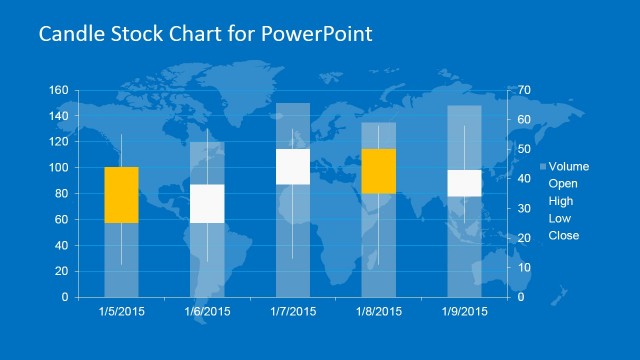
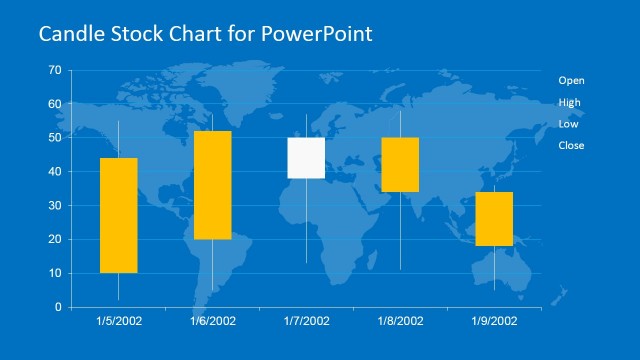
Found on the slide design is a candle chart for PowerPoint with a dark gray presentation background. The PowerPoint slide may be used to show the movements in the stocks or other financial instruments which are managed by the business organization. It shows the open, high, low, and close of the stock in the international markets, which may be helpful to the company management in making financial decisions.
The candle chart is shown with bars colored in white and yellow. The labels of the axes may be replaced with the appropriate titles. The PowerPoint template also shows a world map watermark found behind the candle chart PowerPoint diagram. All PowerPoint objects are 100% customizable to suit the presenter’s needs and preferences.
Return to Candle Stock Chart for PowerPoint.