Candlestick Chart for PowerPoint Blue Background
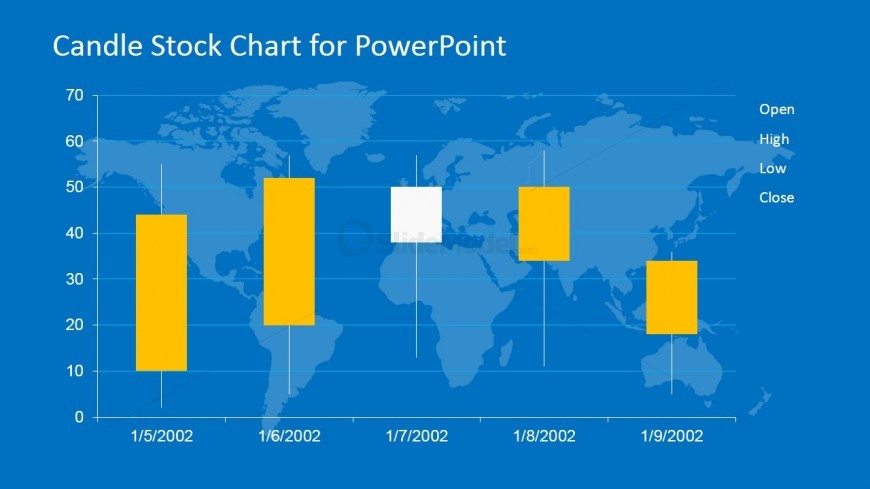
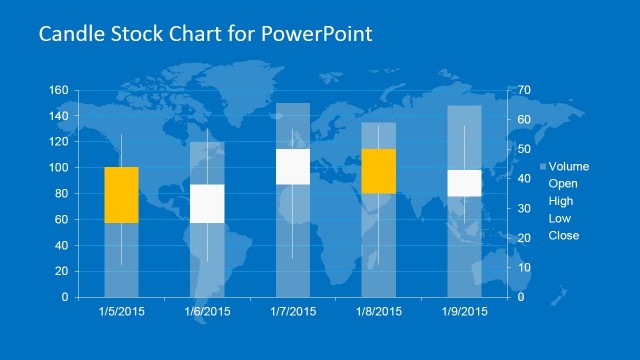
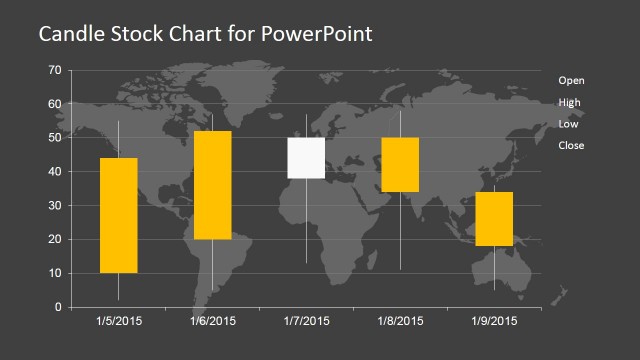
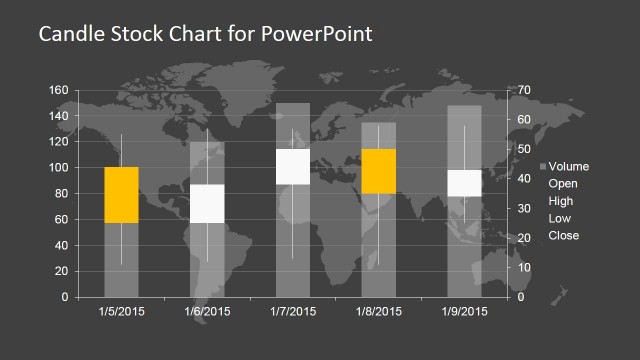
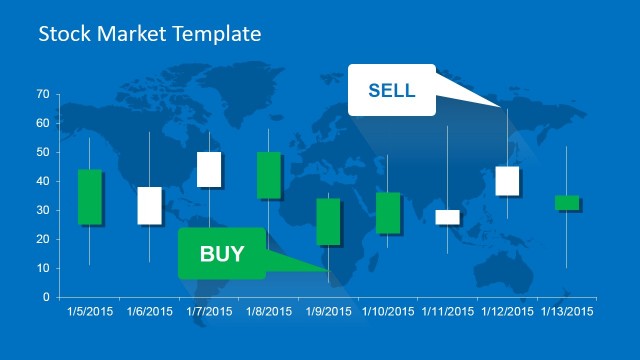
The candlestick chart for PowerPoint found on this slide design may be used to describe price movements in the company stocks and investments over several periods. It may be utilized in the marketing of a certain stock for consideration by the organization management.
The chart PowerPoint graphic covers a majority of the PowerPoint slide, and has yellow and white bars. The x- and y-axis labels may be replaced with appropriate titles by editing the text placeholders. The blue world map watermark in the presentation background suggests that the slide design may be used in international topics for discussion. All PowerPoint objects are 100% customizable to suit the presenter’s needs and preferences.
Return to Candle Stock Chart for PowerPoint.