Slide 3 of 4 from Spheres with Editable Fill Levels
1194-spheres-with-levels-3
Editable Fill Level Spheres Diagram
- Diagram
- Other
- Comparison Slide
- 16:9
- 100% Editable
The Editable Fill Level Spheres slide from the Spheres with Editable Fill Levels template provides a clear visual comparison of progress and capacity using colored spheres with percentage indicators. Ideal for business presentations and corporate slide decks, this layout enhances understanding of performance metrics through editable shapes and text placeholders, making it a practical choice within professional slide templates.
What’s on This Slide
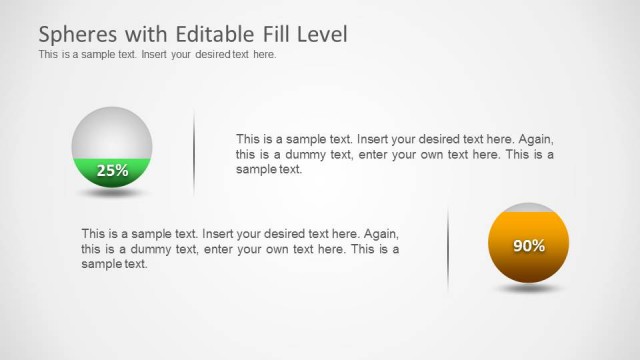
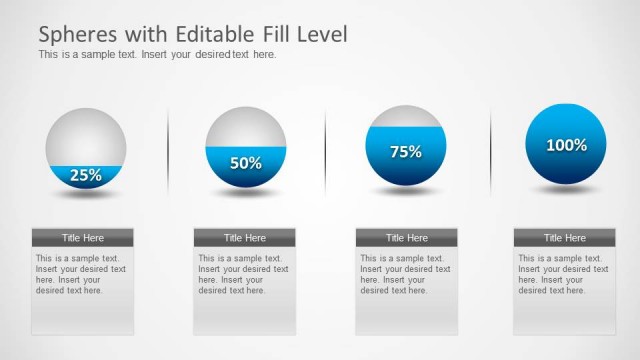
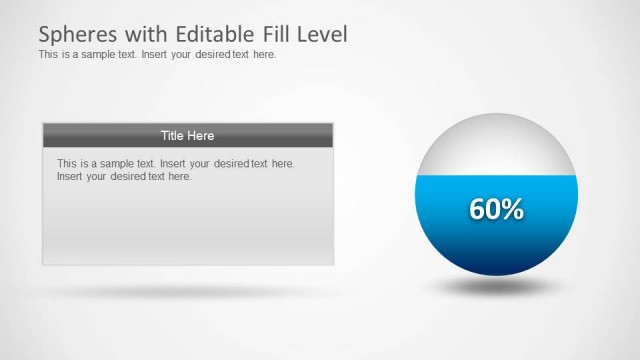
The slide features two spheres representing fill levels of 50% and 75%. The left sphere is blue with a white top, displaying the percentage inside. The right sphere is red with a white top, also showing its percentage. Each sphere is accompanied by text placeholders positioned to the right, with a vertical divider separating the two sections. The background is light gray, creating a neutral backdrop for the colored spheres. The visual hierarchy emphasizes the spheres, with the percentages prominently displayed within them.
How to Use It
This layout serves as a percentage comparison tool, effectively illustrating varying fill levels in a visual format. It fits well in presentations discussing progress, capacity, or performance metrics. This slide can be used in business contexts to represent project statuses or in scientific discussions to depict liquid levels. It is particularly useful in scenarios where visual representation of data is necessary to enhance understanding.
Text Placeholders & Capacity
Keep your copy within these limits so it fits without resizing. Node body slots can hold about 15-20 words each.
| Placeholder | Count | Max characters (approx.) |
|---|---|---|
| Item heading | 2 | 2 |
| Item body | 2 | 100 |
| Slide title | 1 | 60 |
Slide Keywords
Download unlimited PowerPoint templates, charts and graphics for your presentations with our annual plan.
DOWNLOADReturn to Spheres with Editable Fill Levels.