Slide 1 of 4 from Spheres with Editable Fill Levels
1194-spheres-with-levels-1
Editable Fill Level Spheres Diagram
- Diagram
- Other
- Process Slide
- 16:9
- 100% Editable
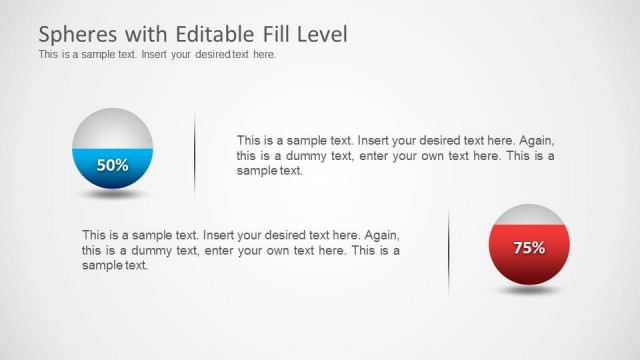
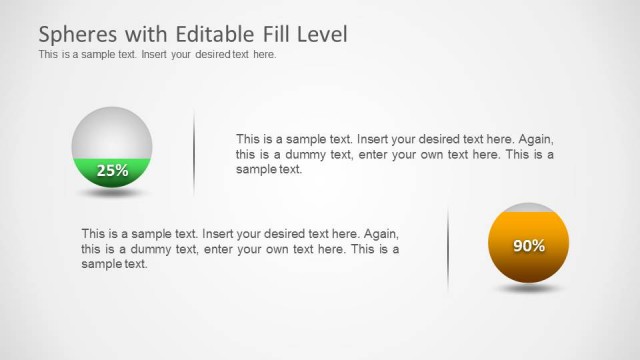
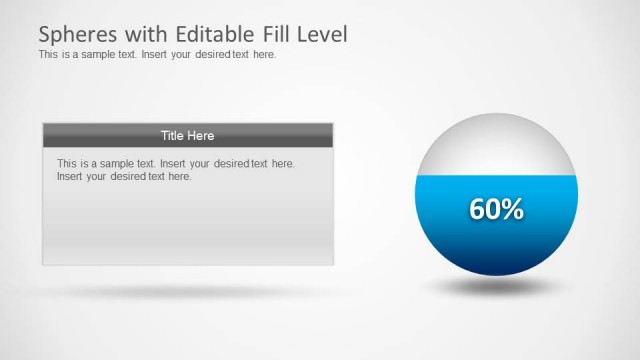
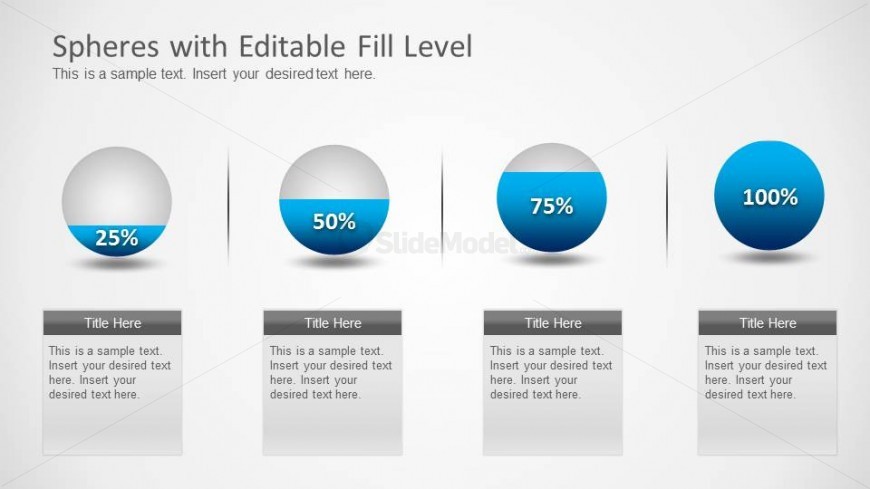
The Editable Fill Level Spheres slide from the Spheres with Editable Fill Levels template offers a clear visual method for displaying percentage data using four gradient-filled spheres. This slide layout is ideal for business presentations or scientific data presentations requiring a straightforward comparison of progress or capacity metrics. Its design integrates editable shapes and text boxes, making it a practical choice for slide decks focused on project status updates and performance metrics.
What’s on This Slide
The layout features four spheres aligned horizontally, each representing different fill levels: 25%, 50%, 75%, and 100%. Each sphere is accompanied by a rectangular text box below, aligned centrally, for titles and descriptions. The spheres are circular with a gradient fill, transitioning from light to dark blue, while the text boxes have a white background. The overall background is light gray, enhancing the visibility of the spheres. Visual hierarchy is established through size variation and color contrast, with the spheres being the focal point of the slide.
How to Use It
This layout serves to visually represent percentage data through liquid-filled spheres, making it suitable for progress tracking or capacity explanations. It fits well in a presentation sequence after introducing a concept and before detailing specific metrics. Ideal scenarios include project status updates, performance metrics, or scientific data presentations, where visual representation of data enhances understanding and engagement. The structured arrangement allows for easy comparison across different fill levels.
Text Placeholders & Capacity
Keep your copy within these limits so it fits without resizing. Node labels can hold up to 3 characters, titles can hold up to 50 characters, and body text can hold up to 150 characters.
| Placeholder | Count | Max characters (approx.) |
|---|---|---|
| Item heading | 4 | 3 |
| Title | 4 | 50 |
| Body paragraph | 4 | 150 |
Slide Keywords
Download unlimited PowerPoint templates, charts and graphics for your presentations with our annual plan.
DOWNLOADReturn to Spheres with Editable Fill Levels.