Slide 2 of 3 from Speedmeter Shape for PowerPoint Dashboards
Speedometer Shape for PowerPoint
Speedometer Dashboard for KPIs
- Diagram
- Other
- Kpi Reporting Slide
- 16:9
- 100% Editable
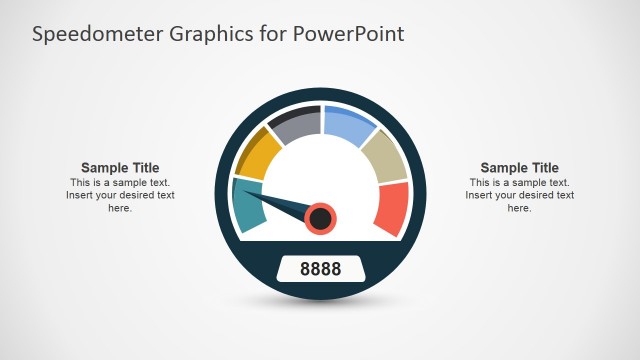
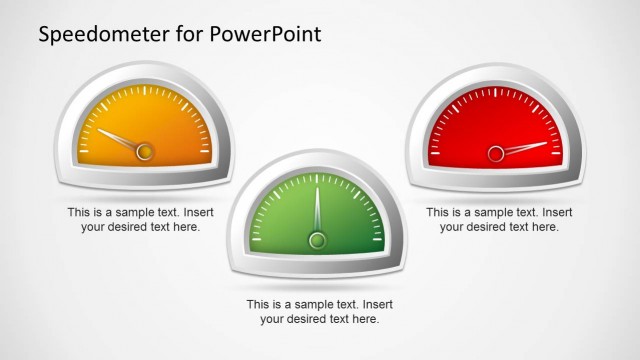
The Speedometer Dashboard slide from the Speedmeter Shape for PowerPoint Dashboards template offers a clear and concise way to present KPIs and project status updates. This slide layout integrates a vector speedometer gauge alongside editable text placeholders, making it suitable for business presentations and performance reviews. Its clean design enhances data visualization, supporting effective communication in corporate slide decks and pitch deck templates.
About This Slide
Template for PowerPoint containing a nice speedometer shape that you can easily edit and copy and paste into your own presentations.
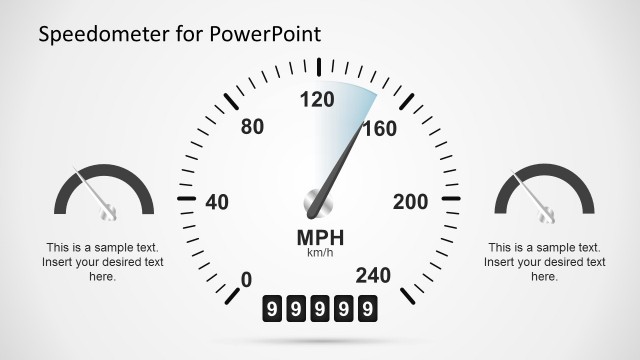
You can use this speedometer template for PPT presentations to make a dashboard in PowerPoint and adjust the editable needle in any desired position.
What’s on This Slide
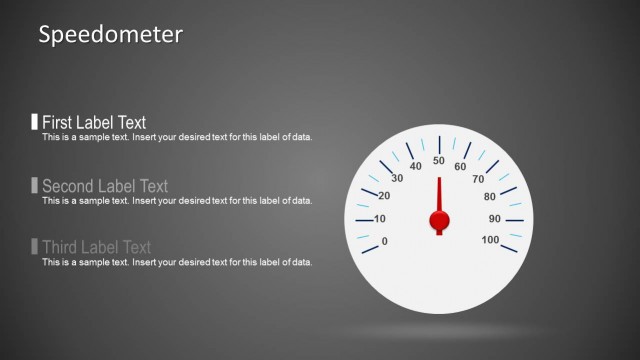
The slide features a central speedometer graphic positioned prominently to the right. It displays a circular gauge with a black background and a red needle indicating values from 0 to 20. To the left of the speedometer, there are three text placeholders stacked vertically. Each placeholder is aligned left, with the first two in blue and the third in red. The text placeholders are labeled 'First Label Text,' 'Second Label Text,' and 'Third Label Text,' with sample text beneath each. The overall layout is clean, with a light background enhancing visibility.
How to Use It
This layout serves as a performance dashboard, ideal for displaying key performance indicators (KPIs) in a concise manner. It fits well in a presentation sequence following an introduction or problem statement, effectively summarizing data visually. This slide is suitable for business meetings, project updates, or performance reviews where quick insights into metrics are needed. It can be used to highlight progress, targets, or comparisons against benchmarks.
Text Placeholders & Capacity
Keep your copy within these limits so it fits without resizing. Label slots can hold about 5-7 words each.
| Placeholder | Count | Max characters (approx.) |
|---|---|---|
| Item heading | 3 | 30 |
| Item body | 3 | 70 |
Slide Keywords
Download unlimited PowerPoint templates, charts and graphics for your presentations with our annual plan.
DOWNLOADReturn to Speedmeter Shape for PowerPoint Dashboards.