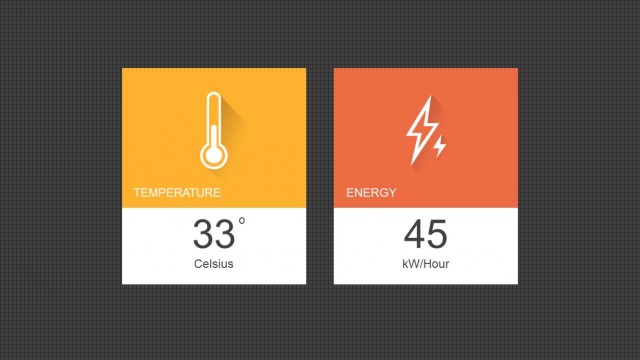
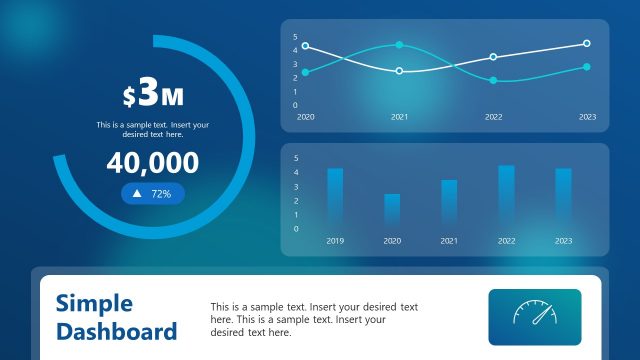
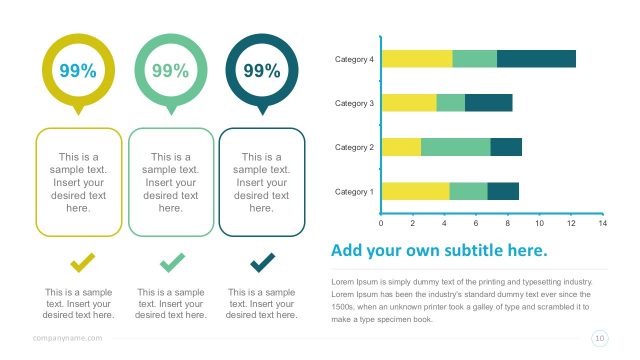
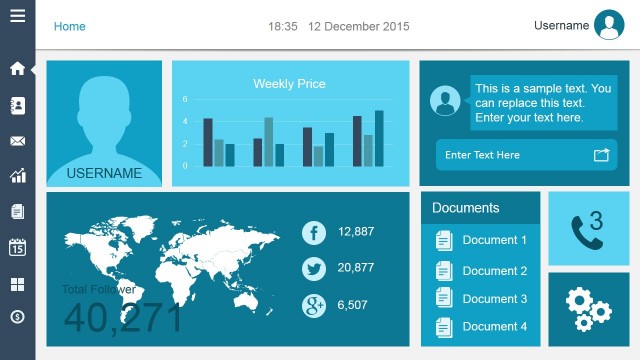
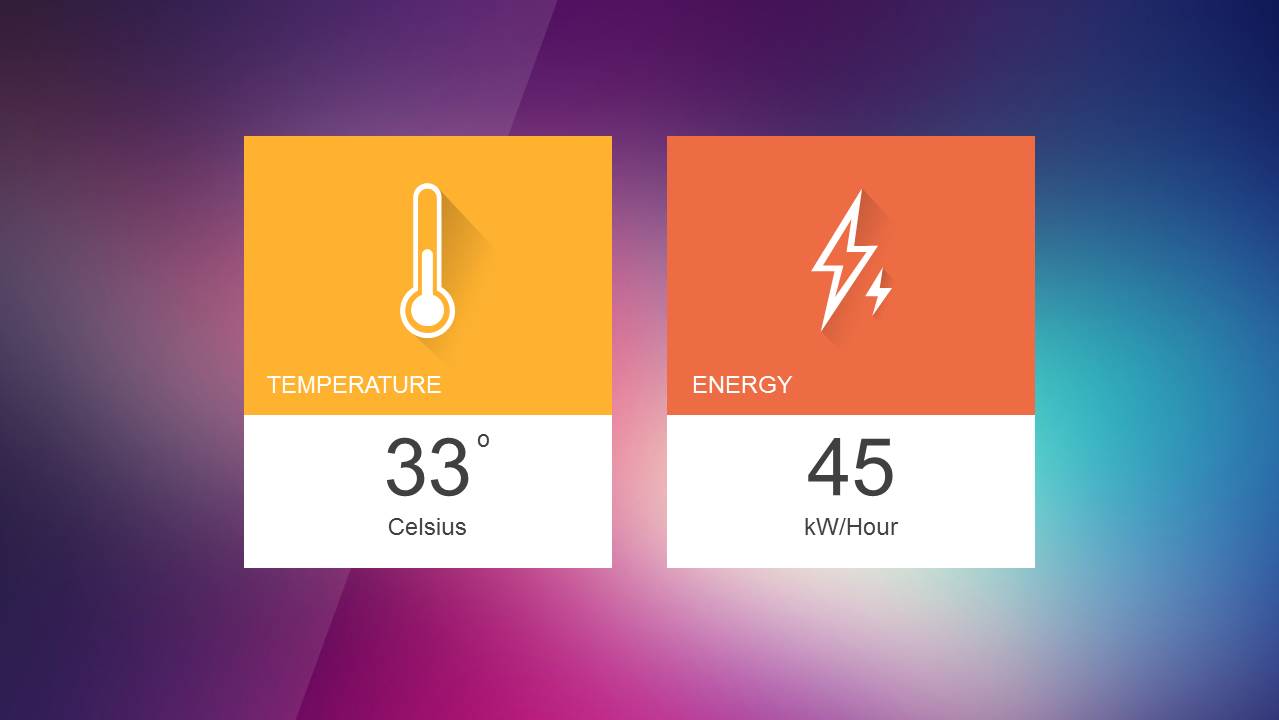
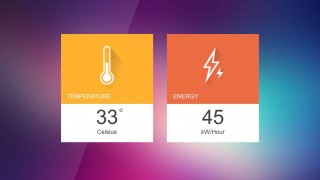
Simple Energy Dashboard PowerPoint Template is a presentation dashboard template that you can use in Microsoft PowerPoint to present data with simple slides. This energy dashboard template contains two components in the main slide that you can copy and paste into your own presentations to display two important KPI.
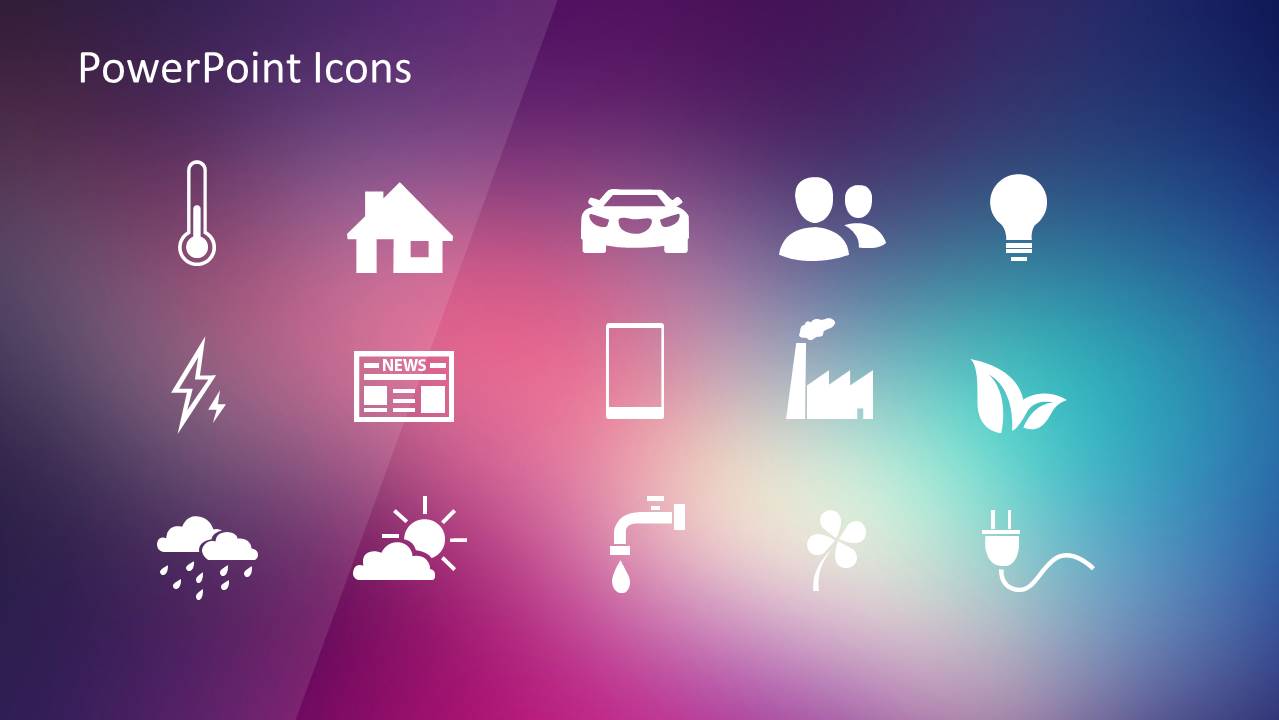
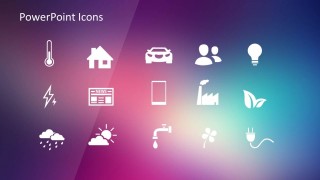
In this energy template we have added two energy components but you can easily customize and edit the text inside each component block. Instead of thermometer icon and text you can use any other icon of your choice. For your convenience, we have included useful PowerPoint icons in the last slide but you can use any other PowerPoint icon in our gallery or any other 3rd party icon or image.
What’s inside this template
Example presentation scenarios
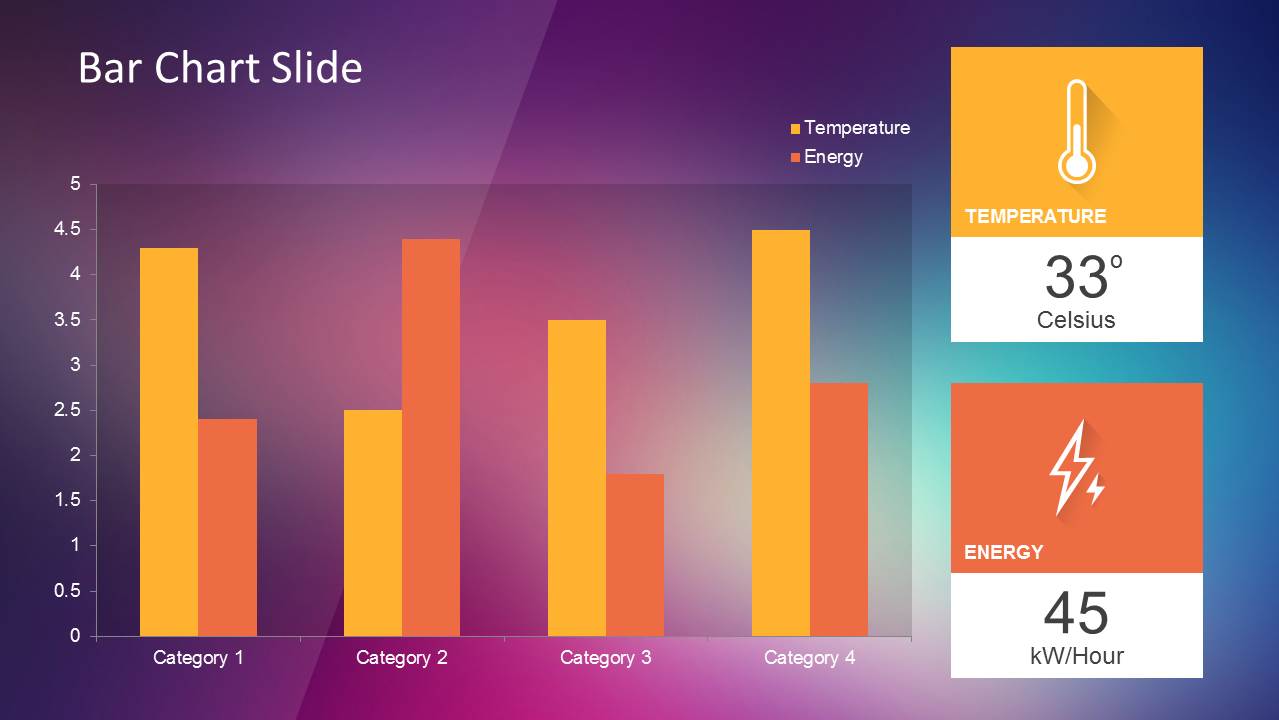
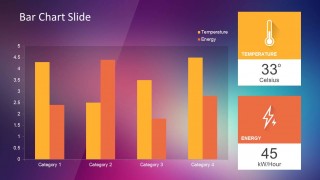
- An energy analyst can use the KPI cards to present current temperature and energy readings before explaining the grouped bar chart comparison by category.
- A facility manager can brief executives on building performance by replacing the card values and using the energy, weather, and building icons for context.
- A sustainability team can report utility or environmental indicators with the chart slide, then adapt the icon sheet for a broader resource dashboard.
- An operations presenter can insert the two dashboard cards into a larger review deck to highlight the most important energy measures on one slide.
Features
- 100% editable presentation template
- Compatible with Microsoft PowerPoint and Google Slides
- 16:9 aspect ratio slides
- Scalable vector shapes, icons and illustrations
- Data-driven charts, editable in Microsoft Excel
- AI-Ready for Microsoft Copilot and Claude
- Instant access and download
Frequently asked questions
Q: How should the two KPI cards be presented so the message stays clear?
A: Introduce the two cards as the headline numbers before showing any chart detail. Keep each tile to one metric, one unit, and one short label, such as temperature or energy. If replacing the sample values, use the same number style on both cards so the audience compares importance rather than formatting.
Q: Who is this template best suited for in a business presentation?
A: This template is best for presenters who need a short energy or facilities update rather than a full operational report. Facility managers, energy analysts, and sustainability teams can use the KPI cards for a fast status view and the grouped bar chart to explain changes across categories or locations.
Q: Why does the design combine large KPI tiles with a chart and icon sheet?
A: The tile layout works like a dashboard snapshot: it gives the audience two numbers they can remember, then the bar chart adds comparison and context. The icon sheet supports visual substitution, so the same structure can shift from temperature and energy to other utility, building, or environmental measures without changing the communication pattern.
Simple Energy Dashboard PowerPoint Template
3-slide energy dashboard presentation template with KPI cards, bar chart, and PowerPoint icons
The Simple Energy Dashboard PowerPoint Template is a 3-slide, 16:9 data dashboard template for presenting energy and temperature metrics. It includes KPI cards, a grouped bar chart, and a PowerPoint icon sheet for energy-related dashboards. It is intended for business, facilities, sustainability, and operations reporting in Microsoft PowerPoint and Google Slides.
- Category
- Shapes
- Rating


 Loading...
- Aspect ratio
- 16:9
- Item ID
- 6576-02
- Colors
 Microsoft PowerPoint
  Microsoft Copilot
  Claude for PowerPoint
 Other formats supported
Subscribe today and get immediate
access to download our PowerPoint templates.