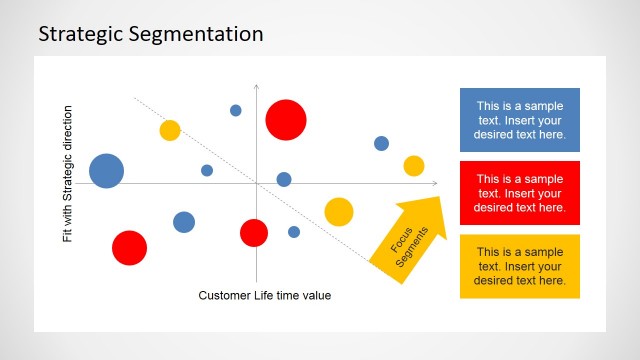
Segmentation Matrix PowerPoint Slide

Descriptive Slide Of The Segmentation Matrix

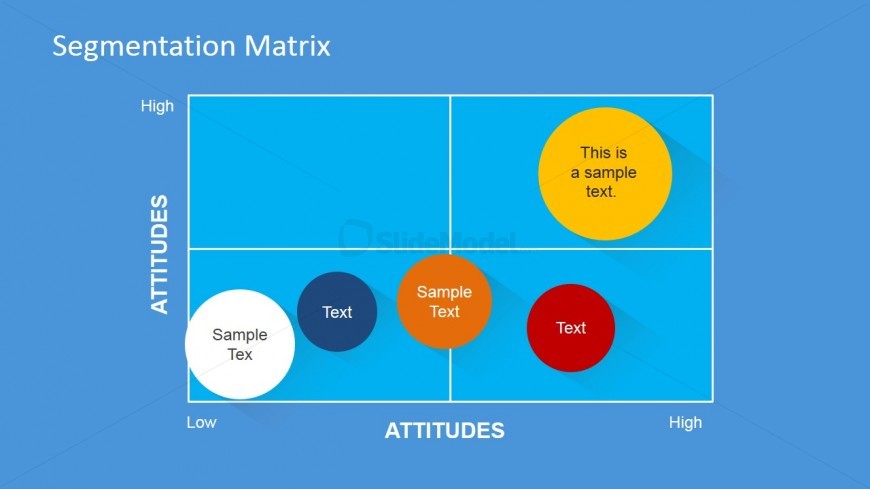
This slide provides a simple flat bubble chart for representing a Segmentation Matrix. Each bubble represents a segment within the chart. The quadrants represent the four deciding factors, Low/Low, Low/High,High/Low, High/High. Each axis concept will depend on the market being segmented. For example, X axis could be attractiveness and Y axis competitiveness.

Return to Segmentation Targeting and Positioning PowerPoint Template.

Activate your subscription

Download unlimited PowerPoint templates, charts and graphics for your presentations with our annual plan.

DOWNLOAD

Slide Tags:

Attitudes High Low Matrix Segmentation

Return to Segmentation Targeting and Positioning PowerPoint Template.

Download Unlimited Content

Our annual unlimited plan let you download unlimited content from SlideModel. Save hours of manual work and use awesome slide designs in your next presentation.

Subscribe Now