Slide 1 of 1 from Sankey Diagram for PowerPoint
PowerPoint Sankey Diagram
Editable Sankey Diagram for Data Flow
- Diagram
- Sankey
- Process Slide
- 16:9
- 100% Editable
The Editable Sankey Diagram slide from the Sankey Diagram for PowerPoint template offers a clear visualization of data flow and resource allocation. This slide layout is ideal for business presentations and process mapping, featuring editable shapes and vector icons to customize the flow representation. It supports effective communication of complex information through a professional slide deck, suitable for corporate presentations and pitch decks requiring detailed data visualization.
About This Slide
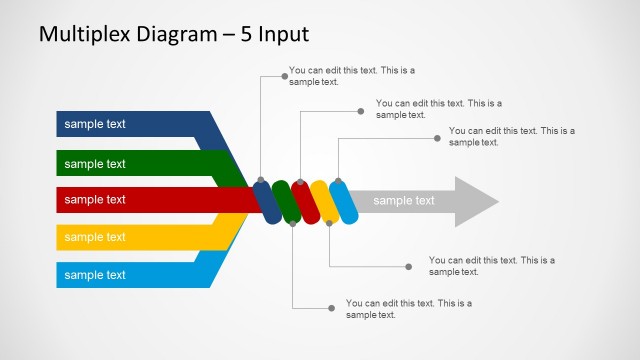
Amazing and flexible Sankey Diagram created with PowerPoint Shapes. This diagram contains multiple initial flows that coverge in a simple higher weight flow. Ideal for power flows or cost transfers between processes.
What’s on This Slide
The slide features a Sankey diagram displaying data flow with multiple colored arrows. The left side contains a legend with two color-coded categories. The diagram's arrows flow horizontally, representing different values, with labels indicating numerical data. There are placeholders for descriptive text positioned around the diagram, including a title at the top and explanatory text on the right. The background is light, enhancing visibility. The overall layout emphasizes the flow of information through varying widths of arrows, indicating relative magnitudes.
How to Use It
This layout serves to visually represent data flow, making it suitable for presentations on energy, resource allocation, or process mapping. It fits well in a sequence following a problem statement, illustrating solutions or outcomes. This diagram can be used in business contexts to show how resources are distributed or to analyze energy consumption. It is particularly effective for discussions on efficiency or optimization in various sectors, including hydraulics and information systems.
Text Placeholders & Capacity
Keep your copy within these limits so it fits without resizing. Body slots are tight, roughly 10 words each.
| Placeholder | Count | Max characters (approx.) |
|---|---|---|
| Slide title | 1 | 30 |
| Item heading | 6 | 5 |
| Body paragraph | 3 | 50 |
Slide Keywords
Download unlimited PowerPoint templates, charts and graphics for your presentations with our annual plan.
DOWNLOADReturn to Sankey Diagram for PowerPoint.