Sales Dashboard Template for PowerPoint
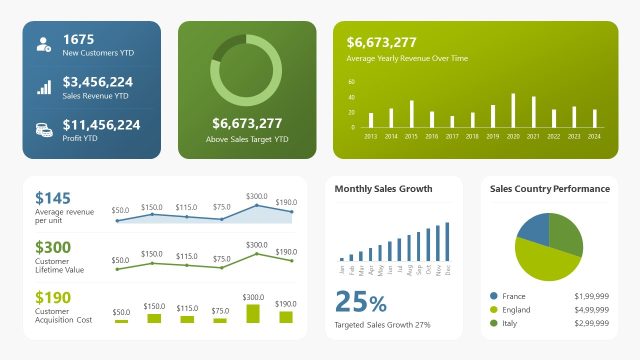
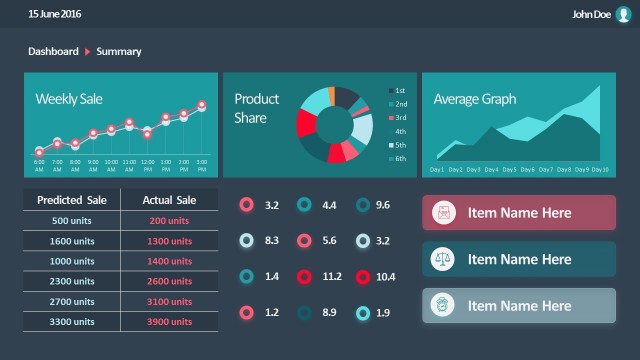
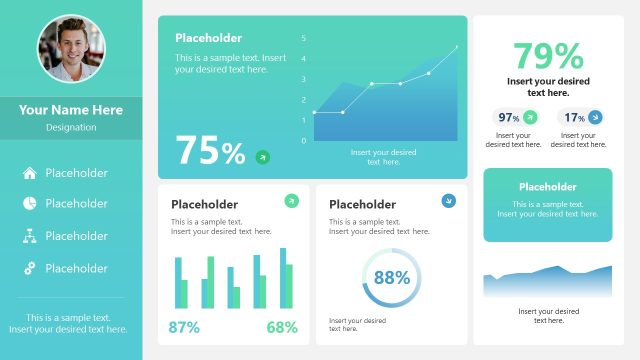
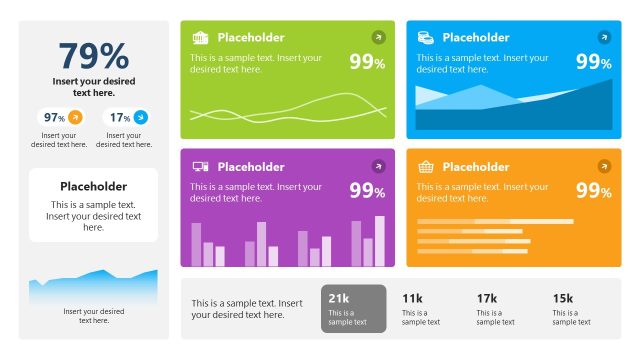
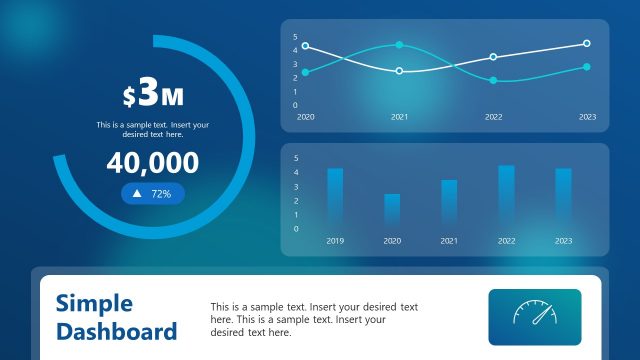
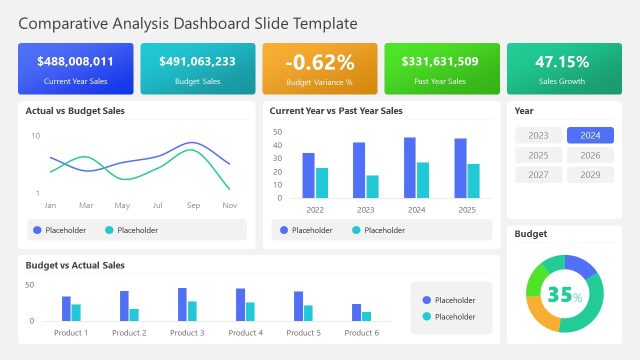
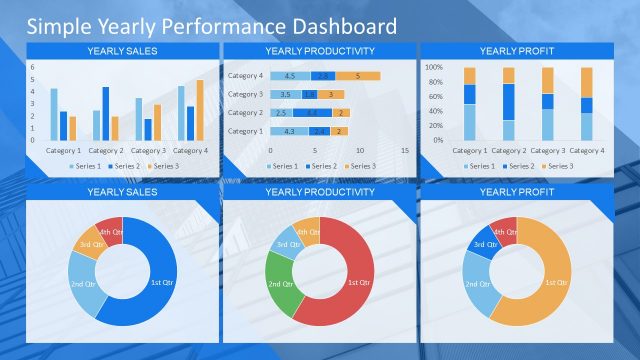
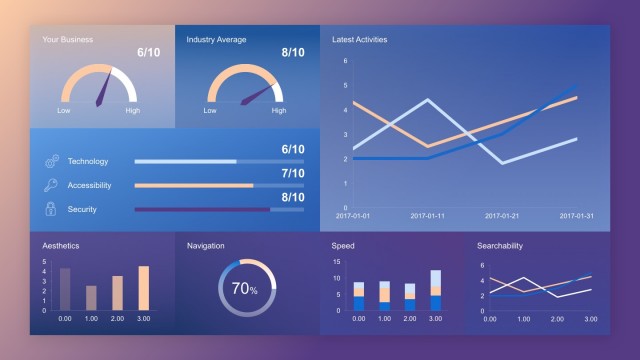
Review your company’s sales performance in your executive sessions using our dynamic Sales Dashboard Template for PowerPoint. The dashboard is a graphical report of various data types relevant to business, marketing, and sales. A dashboard is one of the most famous terms utilized in data visualization. It consists of charts, graphs, and statistical values arranged in an appealing layout to demonstrate the information comprehensively. Sales dashboards are a significant sales data analysis tool, showing complex reports clearly and concisely. We have crafted this simple and modern dashboard template for sales associates and marketers. They can use this PPT template to brief the stakeholders about the current sales performance. This sales dashboard PPT template can help professionals track their sales performance, monitor their growth, identify data trends, and set future estimates and targets.
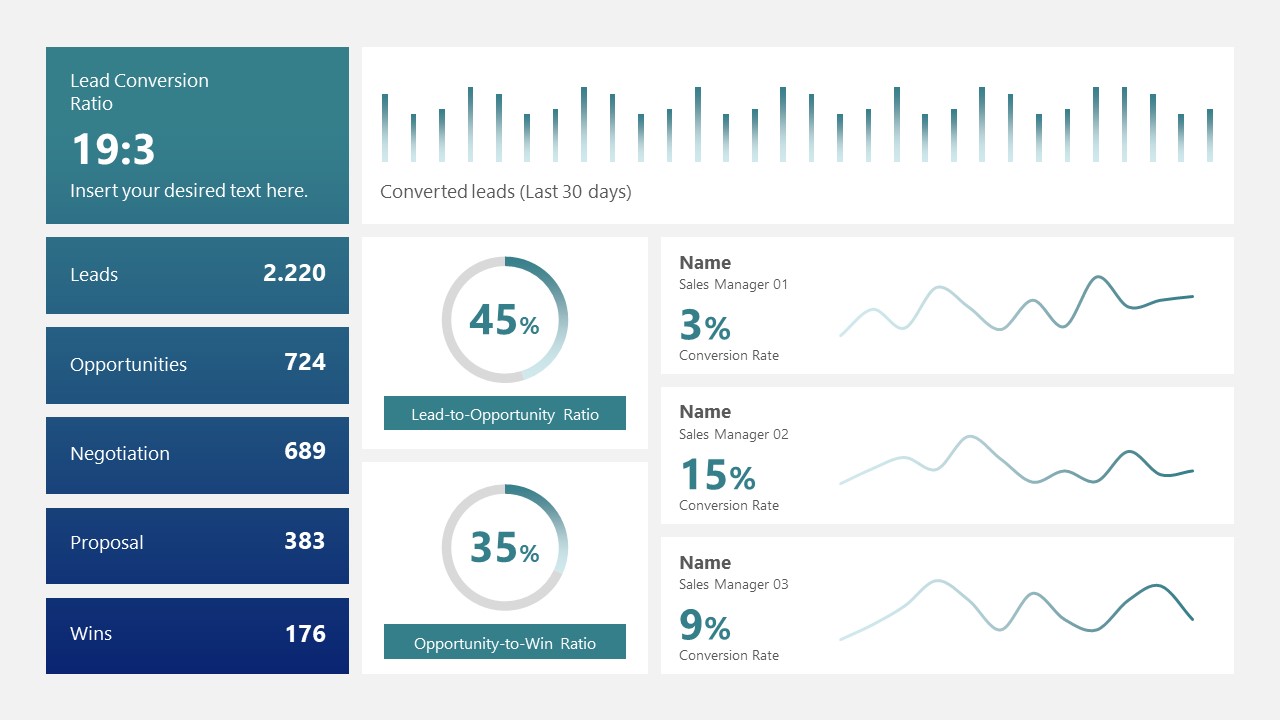
The left side of the dashboard slide consists of six rectangular text boxes displaying the data about the following points:
- Lead Conversion Ratio
- Leads
- Opportunities
- Negotiation
- Proposal
- Wins
Next, on the right side of the Sales Dashboard Template for PowerPoint, a bar chart depicting the converted leads and three line charts are displayed to make the data understandable. Moreover, presenters can use two circular charts in the sheet to describe the data in percentages. We have also provided editable textboxes in the dashboard slide that can be used to write the information about the charts. Also, the dashboard is available in two slides with the same design but different background colors, white and blue. You can also add more graphs or charts to the slide. Moreover, presenters can change the colors, graphical icons, and other template elements according to their preferences. So, download this dashboard template and present your data now!
