Slide 5 of 7 from Research Onion PowerPoint Template
Research Onion Slide for PowerPoint
Research Methodologies Diagram Overview
- Diagram
- Circular Cycle
- Concept Explanation Slide
- 16:9
- 100% Editable
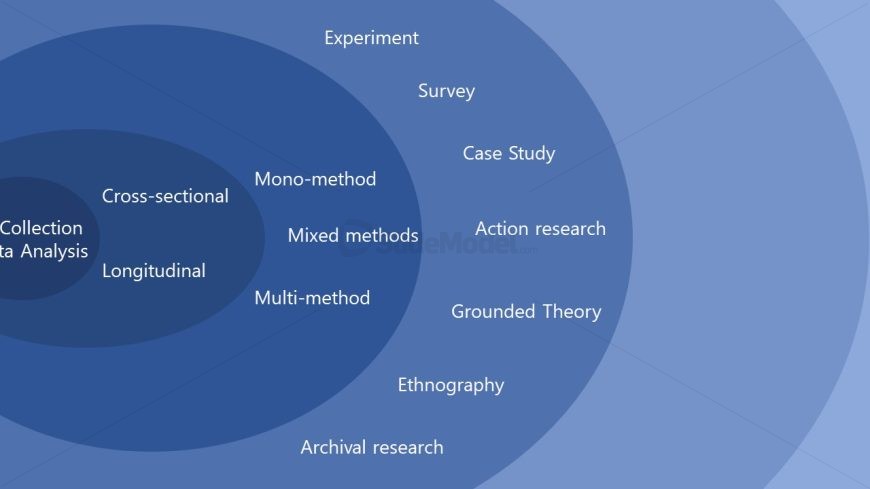
The Research Methodologies Diagram slide from the Research Onion PowerPoint Template visually organizes diverse research methods using a concentric circle diagram. This slide layout is ideal for academic presentations and business presentation decks that require clear explanation of research strategies. It features editable shapes and vector icons to help users customize their slide templates effectively within a corporate presentation or pitch deck template.
What’s on This Slide
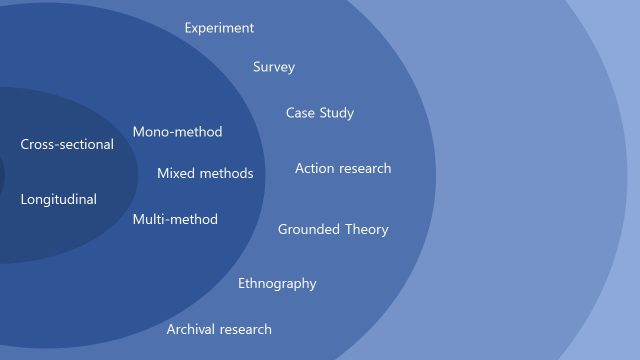
The slide features a concentric circle diagram with varying shades of blue. The innermost circle contains the label 'Collection Data Analysis' positioned centrally. Surrounding this are two additional circles labeled 'Cross-sectional' and 'Longitudinal'. The outermost layer includes various research methods such as 'Experiment', 'Survey', and 'Case Study', arranged in a circular layout. Text placeholders are present for each label, aligned within their respective circles. The overall composition emphasizes a hierarchical structure of research methodologies.
How to Use It
This layout serves as a visual representation of different research methodologies, illustrating their relationships and hierarchy. It fits within a presentation sequence that discusses research strategies or methodologies. This structure is useful in academic or business contexts where various research approaches need to be compared or explained. It can effectively summarize complex information in a clear, visual format, aiding in audience understanding.
Text Placeholders & Capacity
Keep your copy within these limits so it fits without resizing. Node slots can accommodate roughly 8-10 words each.
| Placeholder | Count | Max characters (approx.) |
|---|---|---|
| Item body | 8 | 25 |
Slide Keywords
Download unlimited PowerPoint templates, charts and graphics for your presentations with our annual plan.
DOWNLOADReturn to Research Onion PowerPoint Template.