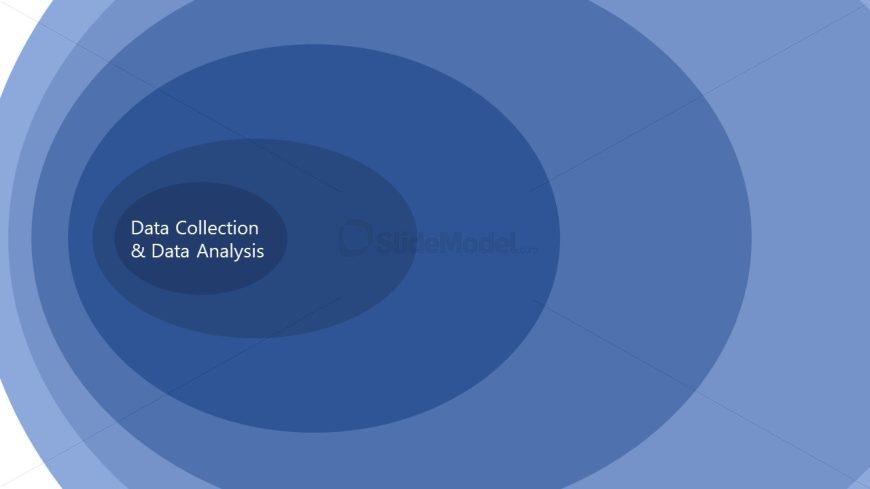
Slide 2 of 7 from Research Onion PowerPoint Template
Multilayered Diagram – Research Onion PPT Template
Data Collection & Analysis Slide
- Diagram
- Nested Containment
- Concept Explanation Slide
- 16:9
- 100% Editable
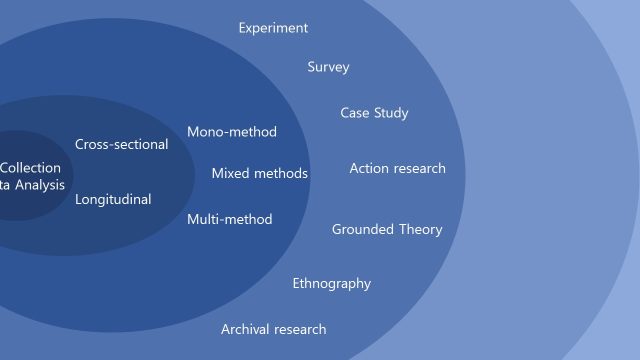
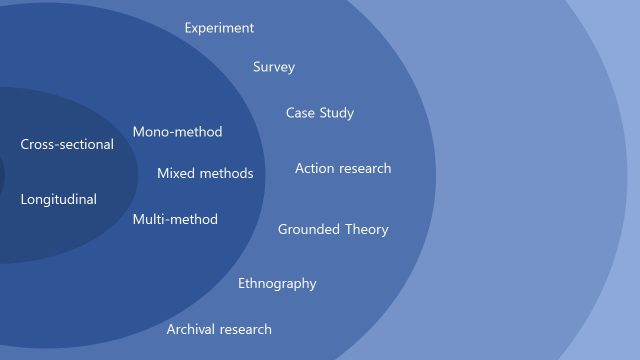
The Data Collection & Analysis slide from the Research Onion PowerPoint Template visually explains research methodologies through a layered diagram. This slide layout uses concentric circles to emphasize data strategies and analysis processes, making it ideal for business presentations and academic discussions. Its clear design supports effective communication in corporate presentations and pitch deck templates focused on data-driven insights.
What’s on This Slide
The slide features a series of concentric circles in varying shades of blue. The innermost circle contains the text 'Data Collection & Data Analysis' centered within it. The text is white and stands out against the darker blue background of the inner circle. The outer circles gradually transition to lighter shades of blue, creating a layered effect. There are no additional text placeholders or images present, emphasizing the central message. The overall composition is balanced, focusing attention on the central text while the surrounding circles provide a visual context.
How to Use It
This layout serves as a visual representation of the data collection and analysis process within a research framework. It fits well in a presentation sequence that discusses research methodologies or data strategies. This slide is useful for illustrating the importance of data collection and analysis in business strategy discussions, market research presentations, or academic contexts. It can be used to highlight key components of the research onion model, making it suitable for educational or professional settings.
Text Placeholders & Capacity
Keep your copy within these limits so it fits without resizing. The node body slot can accommodate about 40 characters comfortably.
| Placeholder | Count | Max characters (approx.) |
|---|---|---|
| Item body | 1 | 40 |
Slide Keywords
Download unlimited PowerPoint templates, charts and graphics for your presentations with our annual plan.
DOWNLOADReturn to Research Onion PowerPoint Template.