Slide 4 of 7 from Research Onion PowerPoint Template
Research Onion PPT Slide with Text
Research Onion Diagram for Data Analysis
- Diagram
- Nested Containment
- Concept Explanation Slide
- 16:9
- 100% Editable
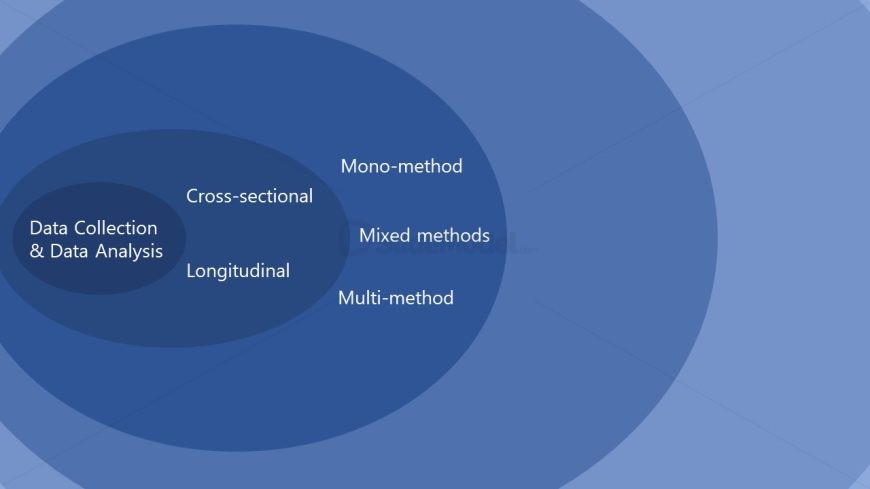
The Research Onion Diagram slide from the Research Onion PowerPoint Template visually explains data collection and analysis methods using concentric circles. This slide layout is ideal for academic presentations and business presentation decks that require clear illustration of research methodologies. It supports the use of editable shapes and vector icons to enhance understanding in slide templates focused on research strategies.
What’s on This Slide
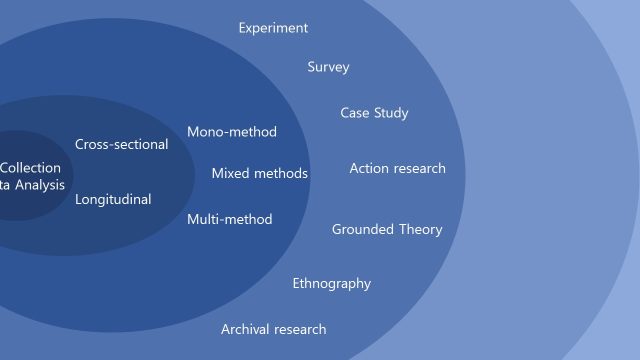
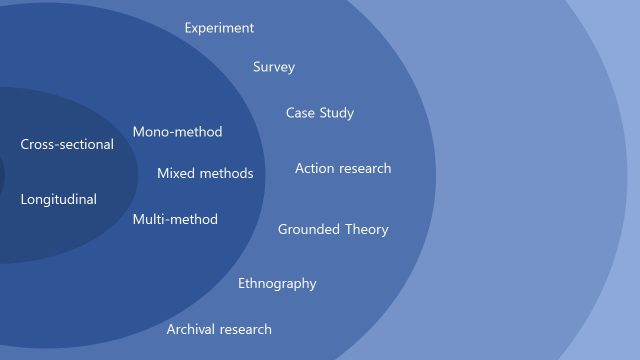
The layout features a series of concentric circles in varying shades of blue. The innermost circle contains the text 'Data Collection & Data Analysis' positioned centrally. Surrounding this are three additional circles labeled 'Cross-sectional,' 'Longitudinal,' and 'Mixed methods,' each positioned to the right of the central text. Further out, the labels 'Mono-method' and 'Multi-method' are placed in the outermost circle. The text is aligned to the right and left, creating a visual hierarchy. The overall composition emphasizes the central theme of data analysis methods.
How to Use It
This layout functions as a visual representation of the research onion model, illustrating various data collection methods. It fits within a presentation sequence focused on research methodologies, particularly in market research or academic contexts. This structure is useful for discussing the relationship between different research methods and their applications in data analysis. It can effectively convey complex information in a simplified manner, making it suitable for educational or strategic discussions.
Text Placeholders & Capacity
Keep your copy within these limits so it fits without resizing. Node slots can hold up to 30 characters each.
| Placeholder | Count | Max characters (approx.) |
|---|---|---|
| Item body | 5 | 30 |
Slide Keywords
Download unlimited PowerPoint templates, charts and graphics for your presentations with our annual plan.
DOWNLOADReturn to Research Onion PowerPoint Template.