Slide 3 of 7 from Research Onion PowerPoint Template
Research Onion Presentation Template Layout
Research Onion Diagram for Data Analysis
- Diagram
- Nested Containment
- Concept Explanation Slide
- 16:9
- 100% Editable
The Research Onion Diagram slide from the Research Onion PowerPoint Template visually explains layered research methodologies using editable shapes and vector icons. Ideal for academic workshops and business presentations, this slide aids in illustrating complex data collection and analysis concepts within a corporate presentation or training session.
What’s on This Slide
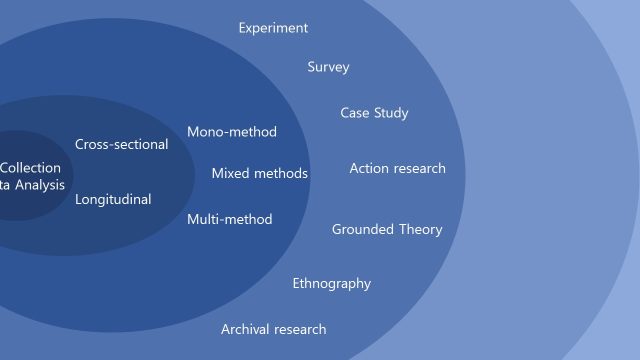
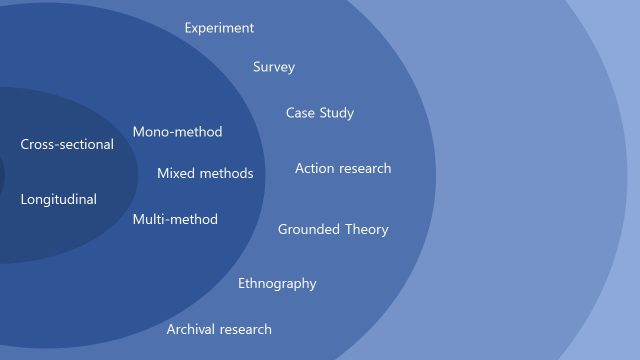
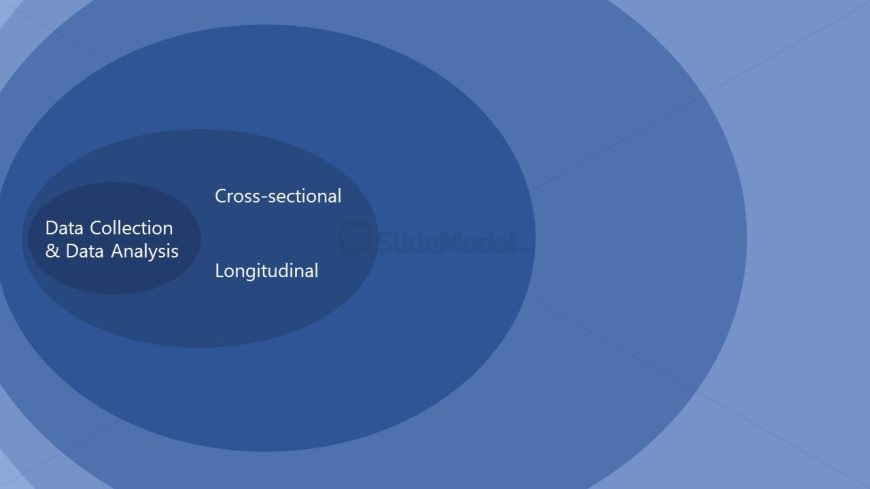
The slide features a layered onion diagram with circular shapes in various shades of blue. The innermost circle contains a label for 'Data Collection & Data Analysis,' positioned centrally. Surrounding this are two additional circles labeled 'Cross-sectional' and 'Longitudinal,' placed to the right and below, respectively. The visual hierarchy emphasizes the central concept, with the outer layers providing context. Text placeholders exist for additional details but are not filled. The overall composition is balanced, with a smooth gradient background enhancing the visual appeal.
How to Use It
This layout serves as a visual representation of research methodologies, illustrating the relationship between data collection and analysis types. It fits well in a presentation discussing research strategies or data analysis frameworks. This structure is useful for academic or business contexts where different methodologies need comparison. It can also be applied in workshops or training sessions focused on research methods, providing a clear visual guide for participants.
Text Placeholders & Capacity
Keep your copy within these limits so it fits without resizing. Node labels can hold up to 30 characters each.
| Placeholder | Count | Max characters (approx.) |
|---|---|---|
| Item body | 1 | 40 |
| Item heading | 3 | 30 |
Slide Keywords
Download unlimited PowerPoint templates, charts and graphics for your presentations with our annual plan.
DOWNLOADReturn to Research Onion PowerPoint Template.