Slide 6 of 7 from Research Onion PowerPoint Template
Editable Research Onion PPT Template with Blue Layers
Research Methodologies Diagram Overview
- Diagram
- Nested Containment
- Concept Explanation Slide
- 16:9
- 100% Editable
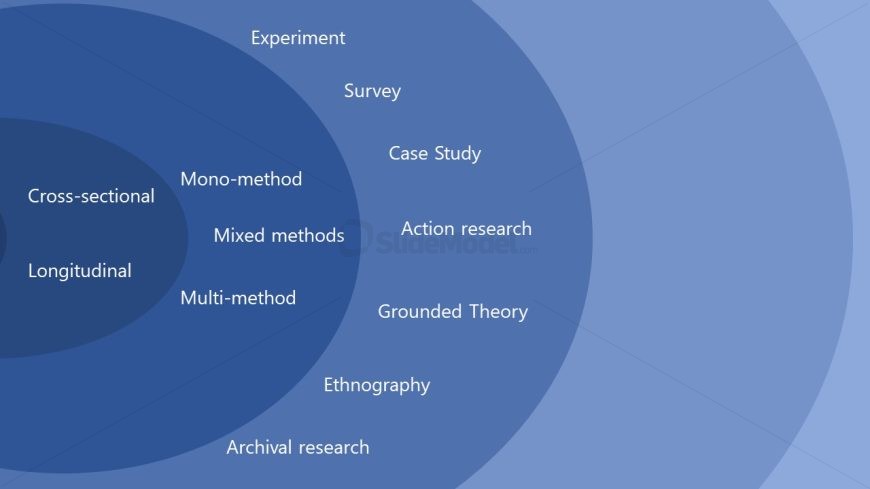
The Research Methodologies Diagram slide from the Research Onion PowerPoint Template visually organizes various research methods using a nested concentric circle design. This slide is ideal for academic presentations and methodology training, providing a clear hierarchy of qualitative and quantitative approaches. It integrates well into business presentation slide decks and pitch deck templates requiring detailed explanation of research design concepts using editable shapes and vector icons.
What’s on This Slide
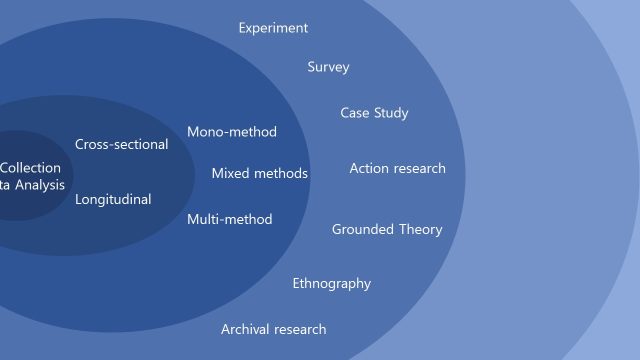
The layout features a concentric circle diagram with varying shades of blue. The largest circle contains the terms 'Longitudinal' and 'Cross-sectional' at the bottom. The middle circle includes 'Multi-method,' 'Mixed methods,' and 'Mono-method.' The innermost circle displays 'Ethnography,' 'Archival research,' 'Grounded Theory,' 'Action research,' 'Case Study,' 'Survey,' and 'Experiment.' Text placeholders are centered within each circle, maintaining a clear visual hierarchy. The overall composition emphasizes the relationships between methodologies through size and positioning.
How to Use It
This layout serves to illustrate the hierarchy and relationships among various research methodologies. It fits well in presentations discussing research design or methodology selection. This diagram can be used in academic settings to compare qualitative and quantitative approaches. It is effective for training sessions or workshops focused on research methods, helping audiences visualize the spectrum of methodologies available.
Text Placeholders & Capacity
Keep your copy within these limits so it fits without resizing. Node slots can accommodate roughly 30 characters each.
| Placeholder | Count | Max characters (approx.) |
|---|---|---|
| Item body | 7 | 30 |
Slide Keywords
Download unlimited PowerPoint templates, charts and graphics for your presentations with our annual plan.
DOWNLOADReturn to Research Onion PowerPoint Template.