Slide 1 of 7 from Research Onion PowerPoint Template
Research Onion Presentation Template – Cover Slide
Research Onion Diagram for Strategy Presentations
- Diagram
- Circular Cycle
- Concept Explanation Slide
- 16:9
- 100% Editable
The Research Onion Diagram slide from the Research Onion PowerPoint Template visually explains layered research methodologies using concentric circles. This slide layout is ideal for academic or business presentations requiring clear concept explanation and is part of a comprehensive slide deck featuring editable shapes and vector icons for customization.
What’s on This Slide
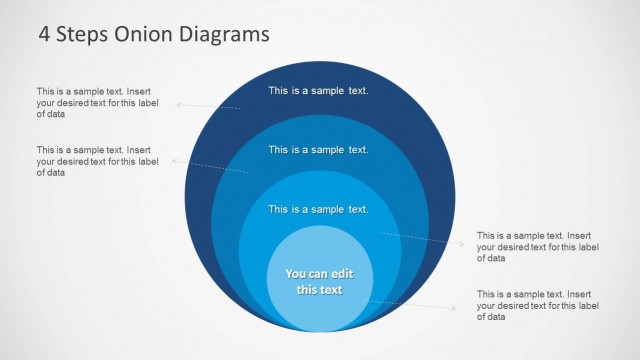
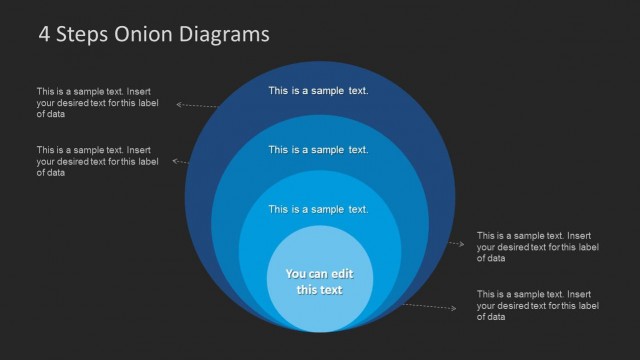
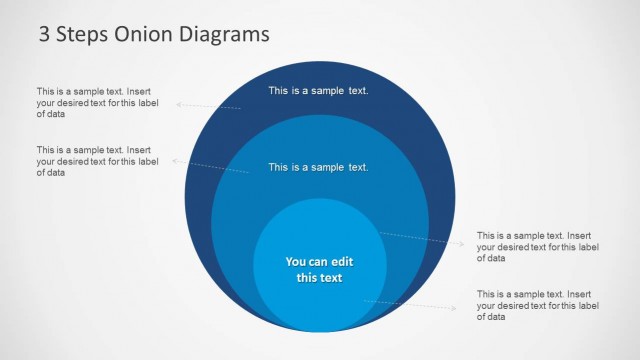
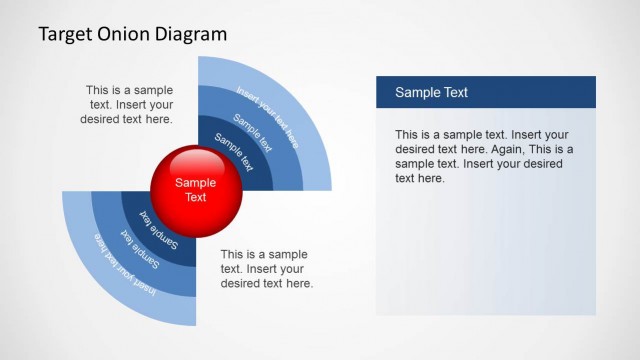
The slide features a concentric circle diagram in varying shades of blue. The largest circle is at the outer edge, gradually decreasing in size towards the center. The circles are layered, creating a visual effect of depth. At the top left, there is a text placeholder for the title, aligned left. The overall composition emphasizes the circular shapes, with no additional images or icons present. The background is white, enhancing the visibility of the blue circles. The visual hierarchy is clear, with the title being the most prominent element.
How to Use It
This layout serves as a visual representation of the research onion framework, illustrating layers of research methodology. It fits well at the beginning of a presentation to introduce the topic or framework. This structure is useful in academic or business contexts where explaining research processes is necessary. It can also be used to summarize complex methodologies in a visually engaging way, making it suitable for discussions on data analysis or market research strategies.
Text Placeholders & Capacity
Keep your copy within these limits so it fits without resizing. The title slot can accommodate around 5-7 words comfortably.
| Placeholder | Count | Max characters (approx.) |
|---|---|---|
| Slide title | 1 | 30 |
Slide Keywords
Download unlimited PowerPoint templates, charts and graphics for your presentations with our annual plan.
DOWNLOADReturn to Research Onion PowerPoint Template.