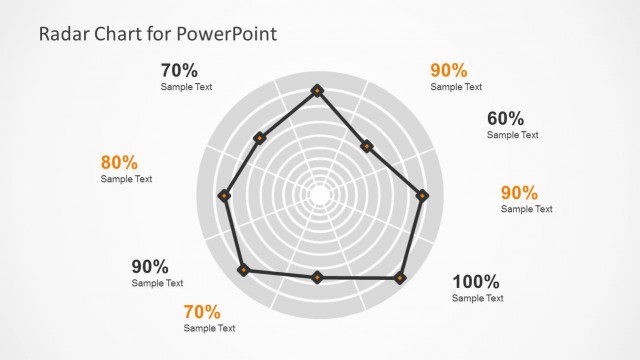
Slide 3 of 3 from Radar Chart Template for PowerPoint
6191-01-radar-chart-3
Radar Chart with Explanatory Text Panels
- Chart
- Radar Chart
- Comparison Slide
- 16:9
- 100% Editable
The Radar Chart with Text Panels slide from the Radar Chart Template for PowerPoint offers a clear visual comparison tool ideal for business presentations involving product feature analysis or sales performance. This slide layout combines a polygon radar chart with editable text panels, making it suitable for data-driven slide decks requiring concise demographic or multivariable insights. Its clean design supports effective communication in corporate presentations using PowerPoint templates or Google Slides templates.
What’s on This Slide
The slide features a central radar chart with a polygon shape, displaying multiple axes radiating from a central point. Each axis is marked with numerical values ranging from 0 to 100, with nodes positioned along these axes. Two text placeholders are located on the right side, one above the other, with the top placeholder highlighted in orange and the bottom in black. Both placeholders contain sample text aligned to the left. The overall layout is clean, with a white background and a simple black outline for the radar chart, emphasizing the data visualization.
How to Use It
This layout serves as a comparative analysis tool, ideal for showcasing multivariable performance across different categories. It fits well in presentations that require data-driven insights, such as product features, sales performance, or demographic comparisons. Positioned as the final slide in a sequence, it effectively summarizes key points discussed earlier, making it suitable for concluding sections of a presentation focused on data analysis.
Text Placeholders & Capacity
Keep your copy within these limits so it fits without resizing. Node labels can accommodate around 6 words each, while body text slots can hold about 15 words each.
| Placeholder | Count | Max characters (approx.) |
|---|---|---|
| Chart title | 1 | 30 |
| Item heading | 6 | 20 |
| Item body | 2 | 100 |
Slide Keywords
Download unlimited PowerPoint templates, charts and graphics for your presentations with our annual plan.
DOWNLOADReturn to Radar Chart Template for PowerPoint.