Slide 2 of 3 from Radar Chart Template for PowerPoint
6191-01-radar-chart-2
Radar Chart Visualization for PowerPoint
- Chart
- Radar Chart
- Comparison Slide
- 16:9
- 100% Editable
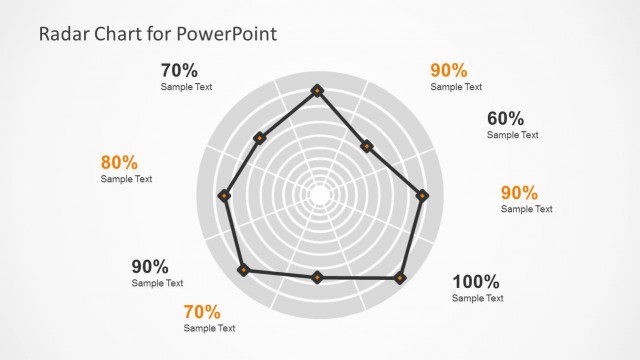
The Radar Chart Visualization slide from the Radar Chart Template for PowerPoint offers a clear and editable slide layout ideal for comparing multiple variables such as product features or sales performance. This slide uses vector icons and editable shapes to enhance data presentation, making it suitable for corporate presentations and business presentation slide decks that require detailed multivariable analysis.
What’s on This Slide
The slide features a radar chart with a central point and multiple axes extending outward. Each axis represents a different variable, marked with percentage values ranging from 0 to 100. The chart is outlined in black with connecting lines forming a polygon shape. Text placeholders are positioned near each axis, displaying sample text aligned to the right or left. The title is centered at the top. The background is light, enhancing the visibility of the chart. The overall layout emphasizes the comparative performance across multiple dimensions.
How to Use It
This layout serves as a visual comparison tool for multivariable performance metrics. It fits well in presentations that require analysis of product features, demographic data, or sales performance. It is useful in business scenarios where stakeholders need to quickly assess strengths and weaknesses across various categories. This slide is positioned after an introductory problem slide, making it suitable for illustrating solutions or outcomes based on the preceding discussion.
Text Placeholders & Capacity
Keep your copy within these limits so it fits without resizing. Node labels can accommodate short phrases, roughly 2-3 words each.
| Placeholder | Count | Max characters (approx.) |
|---|---|---|
| Chart title | 1 | 30 |
| Item heading | 5 | 10 |
| Item body | 5 | 20 |
Slide Keywords
Download unlimited PowerPoint templates, charts and graphics for your presentations with our annual plan.
DOWNLOADReturn to Radar Chart Template for PowerPoint.