Slide 1 of 2 from Free Radar Chart for PowerPoint
Editable Blue Radar PowerPoint Chart
Radar Chart for PowerPoint Presentation
- Diagram
- Radar Chart
- Evaluation Slide
- 16:9
- 100% Editable
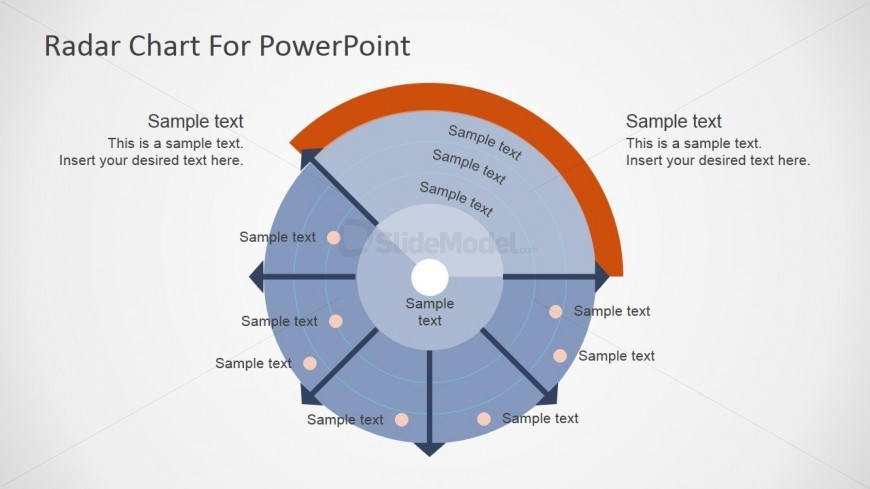
The Radar Chart Layout from the Free Radar Chart for PowerPoint template offers a clear and structured way to visualize multivariate data for performance evaluation and capability assessment. This slide design integrates editable shapes and text placeholders arranged in concentric rings and radial segments, making it ideal for business presentations or pitch deck templates that require detailed data comparison and strategic insights.
What’s on This Slide
The layout features a central circular node surrounded by concentric rings and radial segments. Eight segments extend outward, each containing a labeled dot marker. The top section includes a title placeholder, while the outer ring displays text placeholders aligned with each segment. The color scheme alternates between light and dark shades, enhancing visual contrast. The overall composition is circular, with a clear hierarchy that emphasizes the central node and outer elements. There are placeholders for additional text, positioned strategically around the chart.
How to Use It
This layout serves as a radar chart for visualizing multivariate data. It fits well in presentations that require comparison of multiple dimensions, such as performance metrics or capability assessments. It is suitable for business contexts like project evaluations, product comparisons, or strategic assessments. This slide can be used to illustrate strengths and weaknesses or to identify gaps in performance across various criteria, making it a valuable tool for data-driven discussions.
Text Placeholders & Capacity
Keep your copy within these limits so it fits without resizing. Node labels can hold about 20 characters each.
| Placeholder | Count | Max characters (approx.) |
|---|---|---|
| Slide title | 1 | 30 |
| Item heading | 8 | 20 |
| Item body | 8 | 50 |
Slide Keywords
Download unlimited PowerPoint templates, charts and graphics for your presentations with our annual plan.
DOWNLOADReturn to Free Radar Chart for PowerPoint.


