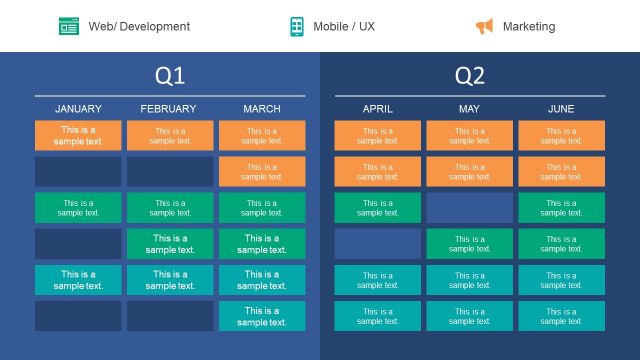
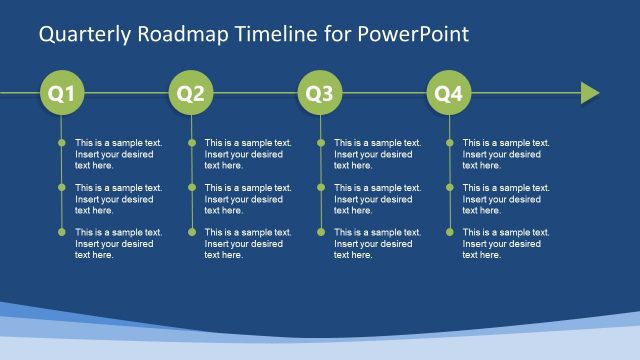
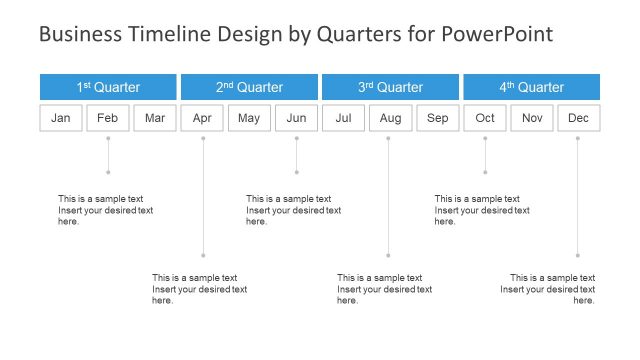
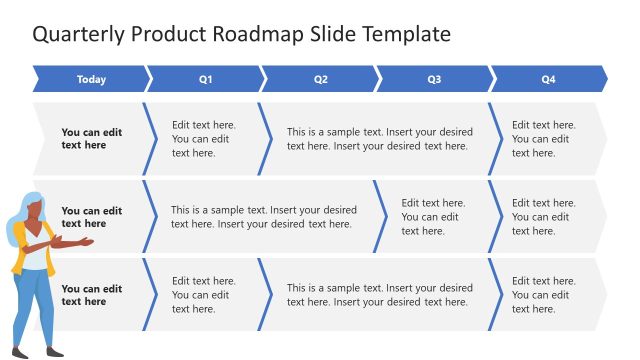
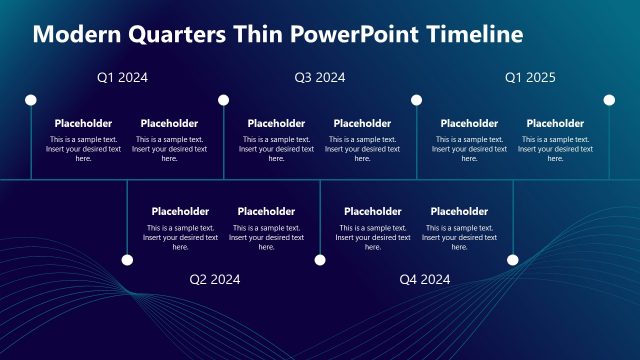
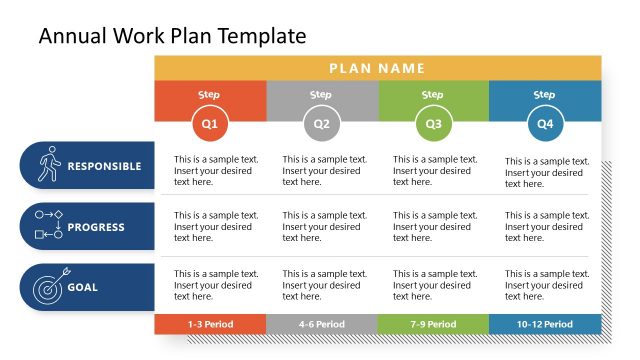
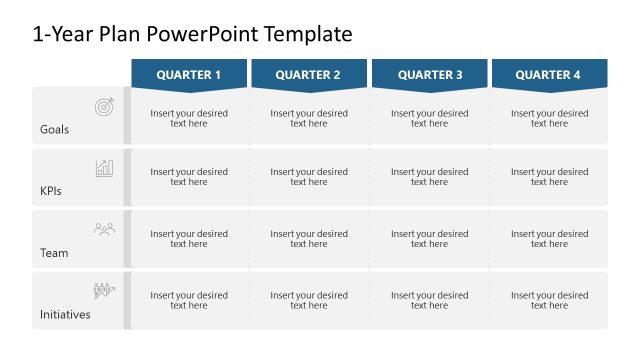
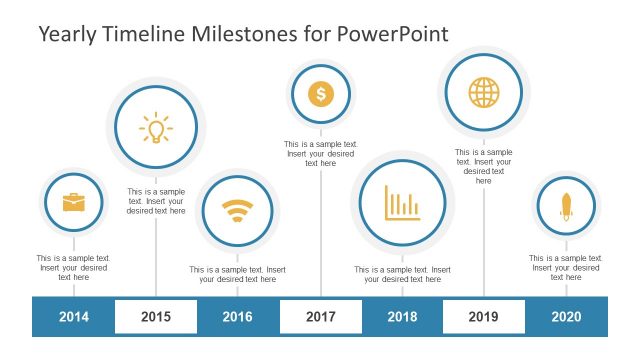
Quarterly Timeline Template for PowerPoint is a work plan template with a creative quarterly presentation timeline design. You can open this QBR presentation timeline in Microsoft PowerPoint and edit the template with your own milestones.
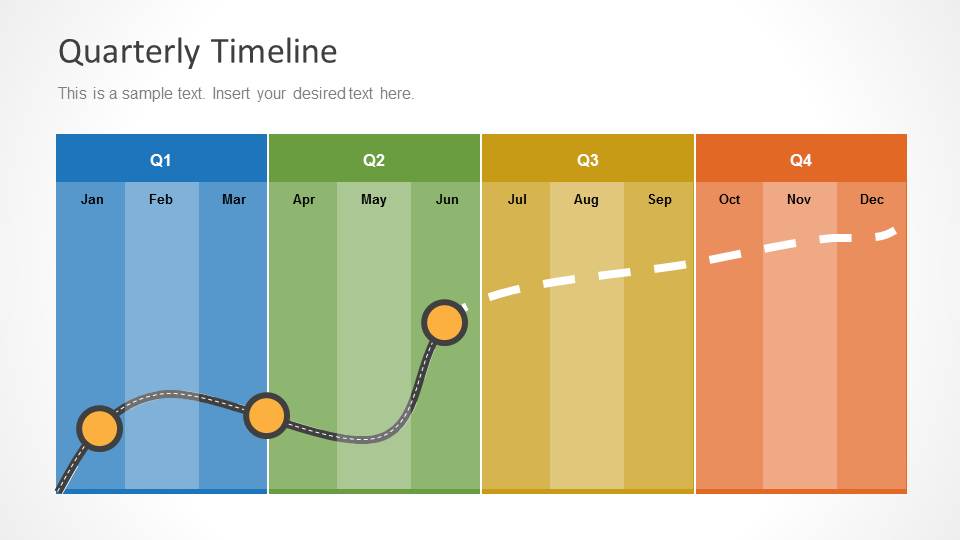
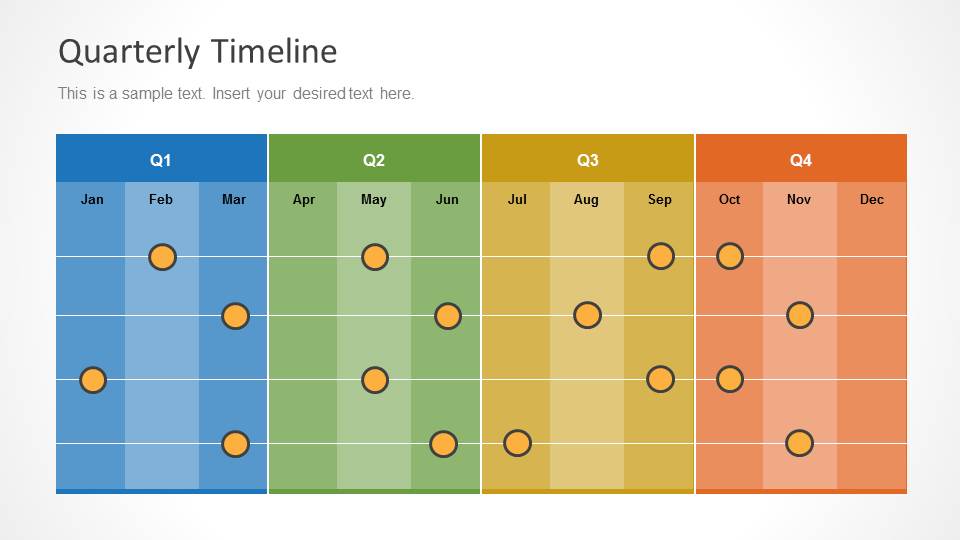
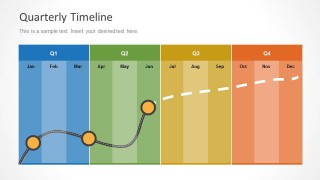
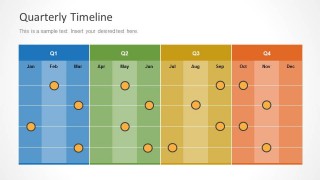
The timeline is organized by quarters so you can easily identify each quarter by colors. Inside each quarter you can find the labels for months. For example, the Q1 has Jan, Feb, and Mar months inside.
This quarterly schedule PowerPoint template design can be of help if you need to prepare a business presentation or financial plan using Microsoft Office tools. You can edit the quarterly timeline design to fit your own presentation needs by filling in the editable text boxes and placeholders.
Alternatively, you can download other QBR templates for PowerPoint & time management charts for presentations, compatible with Microsoft PowerPoint & Google Slides, and including creative timeline templates by quarter. We recommend you read our tutorial on how to create a timeline in PowerPoint and Google Slides.
What’s inside this template
Example presentation scenarios
- A project manager can brief stakeholders on an annual delivery plan by using the Q1 to Q4 roadmap with month labels and milestone markers.
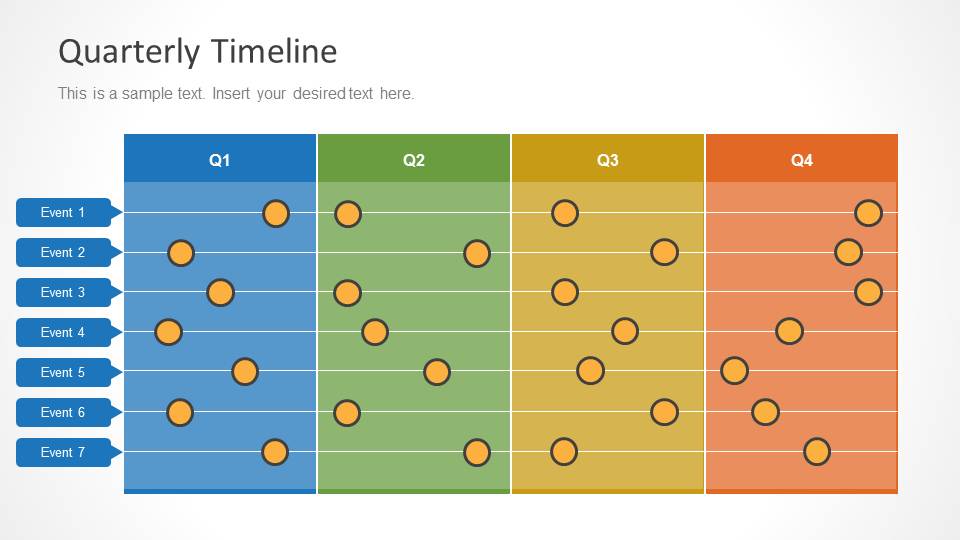
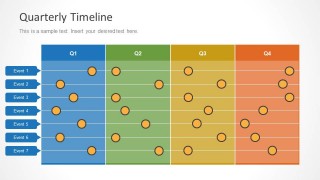
- An operations leader can run a QBR planning meeting by mapping initiatives to the event swimlane timeline and showing which quarter each workstream affects.
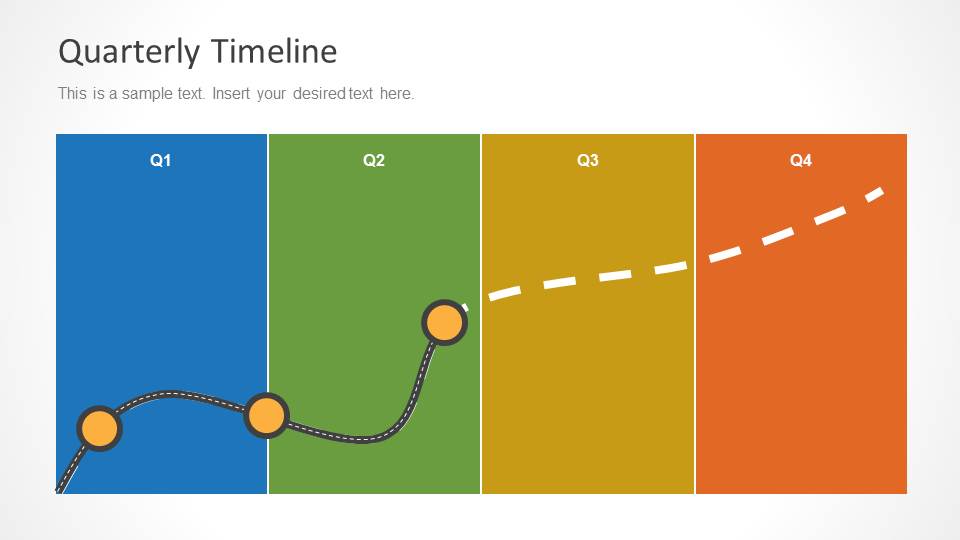
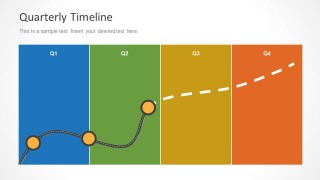
- A finance or strategy presenter can explain a phased business plan by using the simplified four-quarter roadmap with a curved progress path and dashed forecast segment.
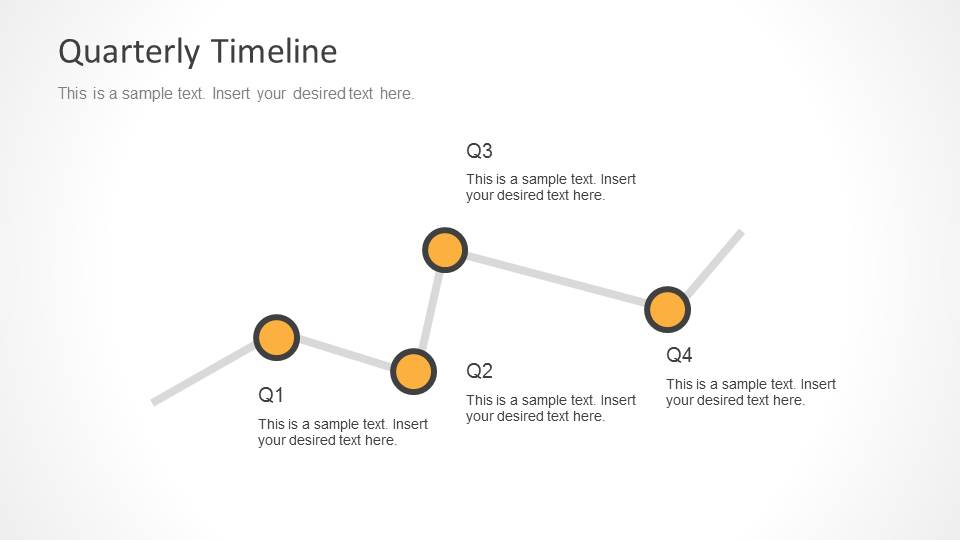
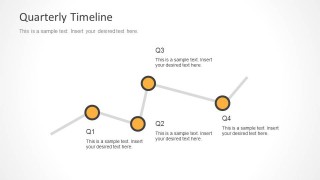
- A program manager can summarize executive milestones by using the minimal Q1 to Q4 path diagram with short callouts beside each marker.
Features
- 100% editable presentation template
- Compatible with Microsoft PowerPoint and Google Slides
- 16:9 aspect ratio slides
- Scalable vector shapes, icons and illustrations
- AI-Ready for Microsoft Copilot and Claude
- Instant access and download
Frequently asked questions
Q: How should a presenter organize the story around this quarterly timeline?
A: Start with the broad four-quarter roadmap to orient the audience, then move to the event swimlane if several initiatives run in parallel. Use the month-labeled grid for detail only when timing matters. Close with the minimal milestone path to restate the few decisions, deadlines, or outcomes the audience should remember.
Q: Who is this template best suited for in a business presentation?
A: It fits project managers, operations leads, finance teams, and executives who need to explain work across Q1, Q2, Q3, and Q4 without building a full project schedule. It is especially useful for QBRs, annual planning sessions, roadmap reviews, and resource planning conversations where quarters matter more than daily task tracking.
Q: Why do the colored quarters and milestone markers make the plan easier to read?
A: The design uses color blocks as a time metaphor: each quarter becomes a clear zone, while orange circles mark decisions, launches, or checkpoints. This reduces the need for dense tables. The audience can scan left to right, see the rhythm of activity, and quickly identify which quarter carries the most important events.
Quarterly Timeline Template for PowerPoint
5-slide quarterly timeline presentation template for roadmaps, QBR schedules, milestones, and month-by-month planning.
This is a 5-slide quarterly timeline presentation template for planning and reporting across Q1 to Q4. It includes a month-labeled quarterly roadmap, event swimlane timeline, milestone grid, four-quarter progress chart, and simplified milestone path for project managers and business teams using Microsoft PowerPoint or Google Slides.
- Category
- Timelines & Planning
- Rating


 Loading...
- Aspect ratio
- 16:9
- Item ID
- 6112-05
- Colors
 Microsoft PowerPoint
  Microsoft Copilot
  Claude for PowerPoint
 Other formats supported
Subscribe today and get immediate
access to download our PowerPoint templates.