Slide 7 of 14 from Quarterly Management Review PowerPoint Template
Financial Results Overview Slide – Quarterly Management Review Template
Financial Results Overview Slide
- Chart
- Bar Vertical
- Financial Summary Slide
- 16:9
- 100% Editable
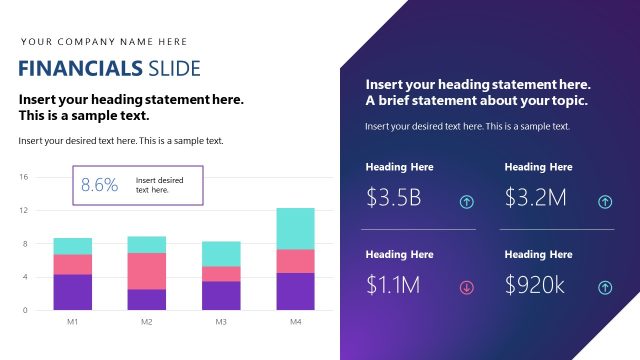
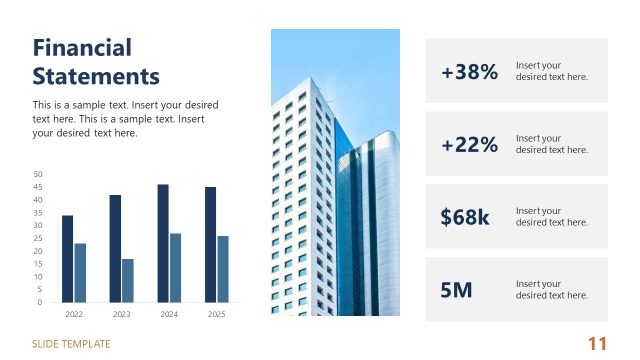
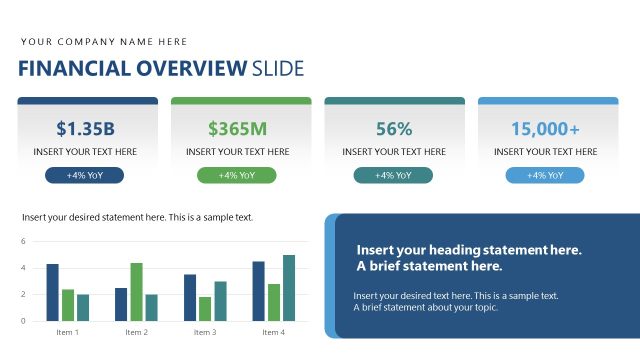
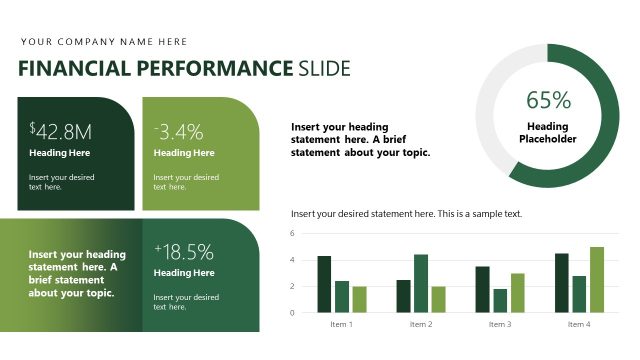
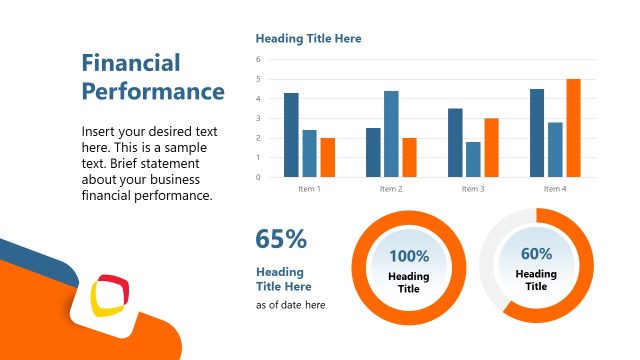
The Financial Results Overview slide from the Quarterly Management Review PowerPoint Template offers a structured layout for presenting key financial metrics and trends. Designed for business presentations and stakeholder reviews, this slide uses editable shapes and a vertical bar chart to clearly illustrate quarterly performance. It integrates well within corporate slide decks focused on financial analysis and decision-making.
What’s on This Slide
The layout features a top section for a company name and a title labeled 'FINANCIAL RESULTS SLIDE.' Below this, there are four rectangular boxes arranged in two columns, each containing a heading and a financial figure, with upward or downward arrows indicating trends. To the right, a bar chart displays data across four months, labeled M1 to M4, with a percentage value highlighted in a rounded rectangle. Text placeholders exist for headings and descriptions, aligned to the left and center, respectively. The background is predominantly white with blue and green accents.
How to Use It
This layout serves to present financial results in a clear, structured manner, suitable for quarterly reviews or performance assessments. It fits within a presentation sequence where financial performance is analyzed after strategic objectives. This slide is ideal for showcasing key financial metrics, trends, and comparisons over time, making it useful for stakeholders reviewing business performance and decision-making.
Text Placeholders & Capacity
Keep your copy within these limits so it fits without resizing. Body slots are tight, roughly 8 words each.
| Placeholder | Count | Max characters (approx.) |
|---|---|---|
| Slide title | 1 | 30 |
| Body paragraph | 3 | 50 |
| Item heading | 4 | 15 |
| Item body | 4 | 10 |
| Chart title | 1 | 20 |
| Data label | 4 | 10 |
| Kpi value | 1 | 10 |
Slide Keywords
Download unlimited PowerPoint templates, charts and graphics for your presentations with our annual plan.
DOWNLOAD