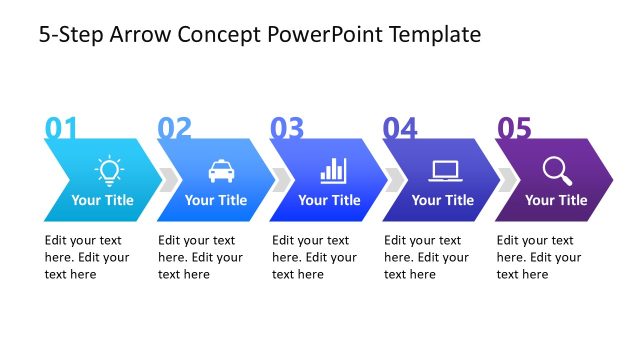
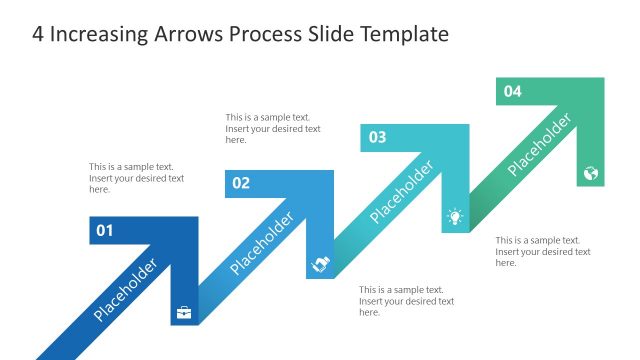
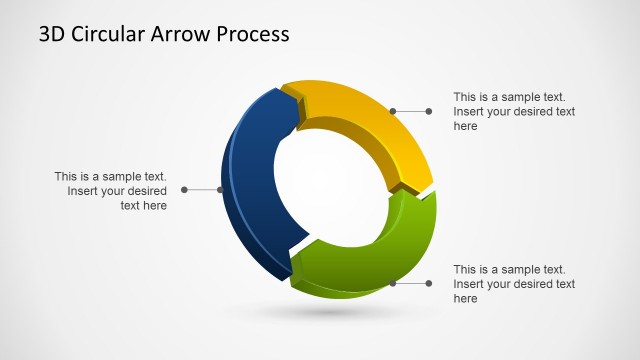
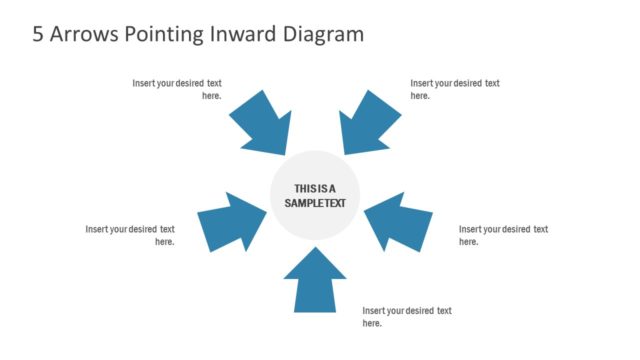
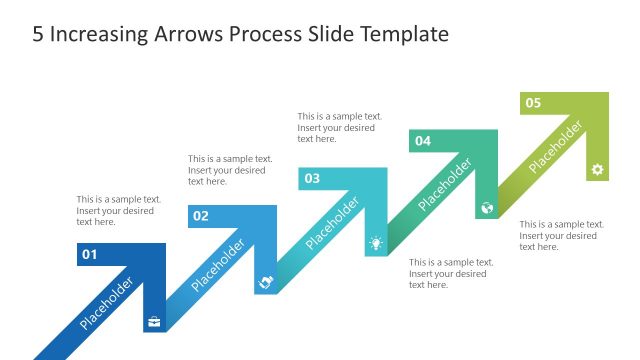
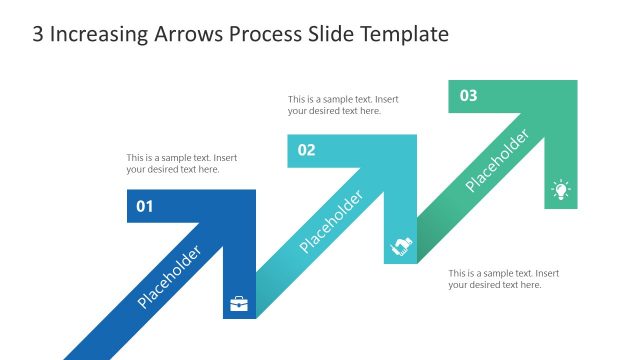
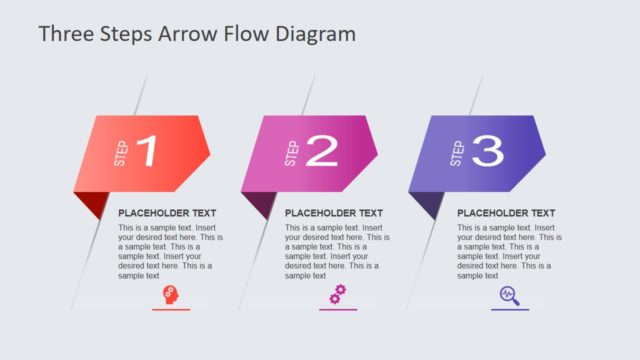
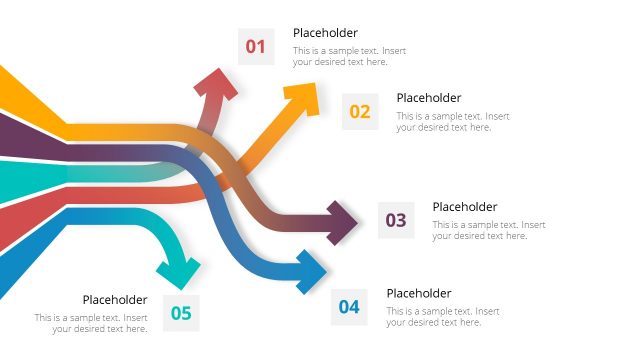
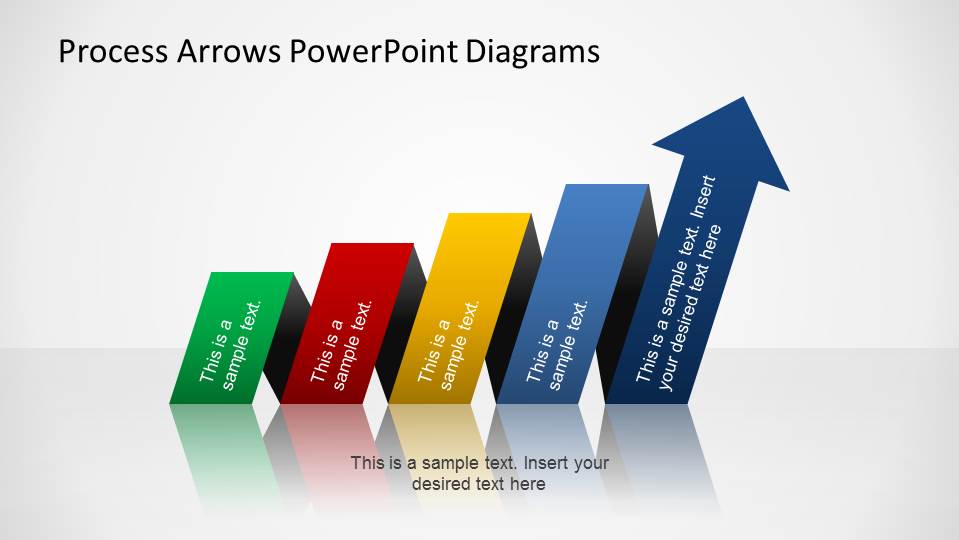
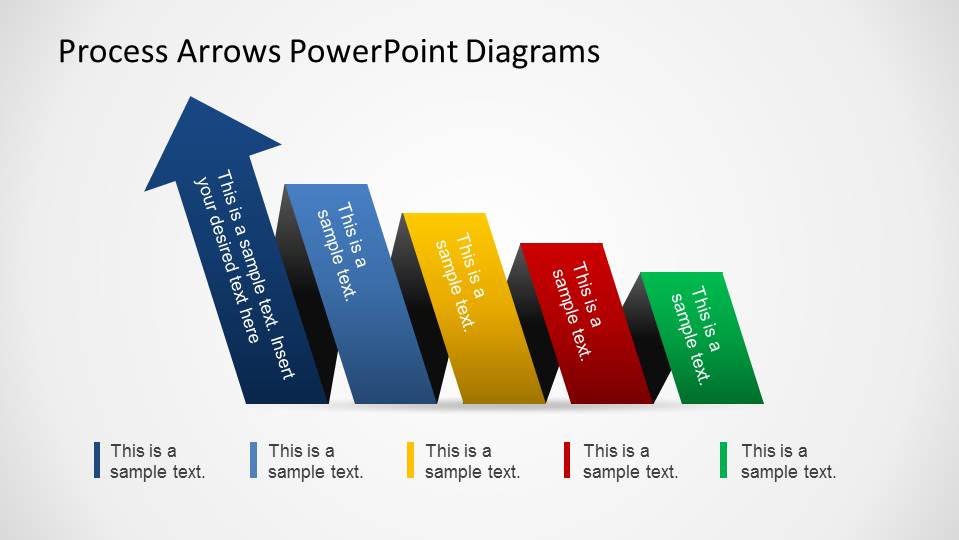
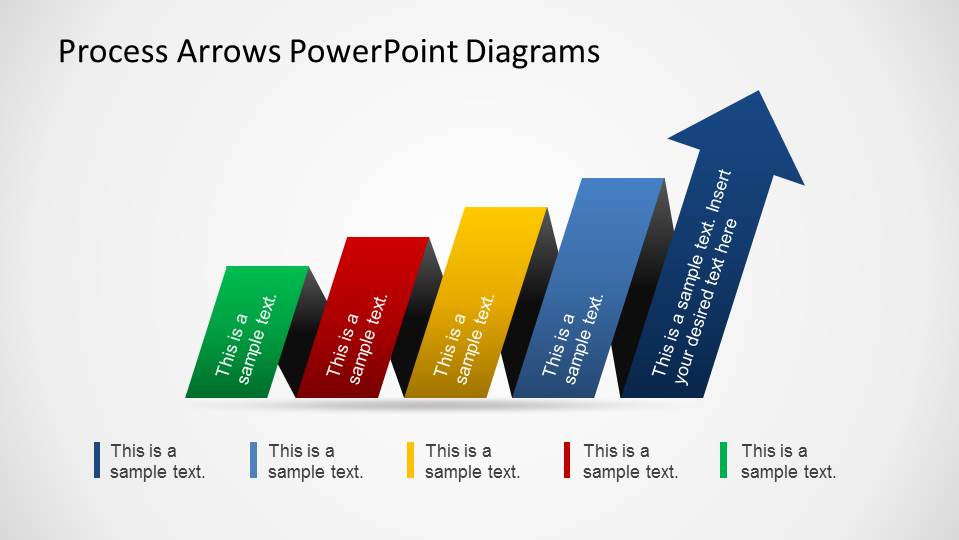
Process Arrows PowerPoint Diagram can be utilized for process flow presentations, marketing funneling or even project progress over milestones. This presentation is created with a flat design, with brilliant colors, that will engage your audience. The main arrow PowerPoint shape is created using increasing steps in the Diagram that resembles a funnel. It includes two directions of the diagram (increasing right, increasing left) to add flexibility to the presenter. Every shape of the Process Arrows PowerPoint Diagram is fully customizable. The user can adapt the Diagram to the theme palette of other presentation or include shapes adapting the chromatic resonance of the template.
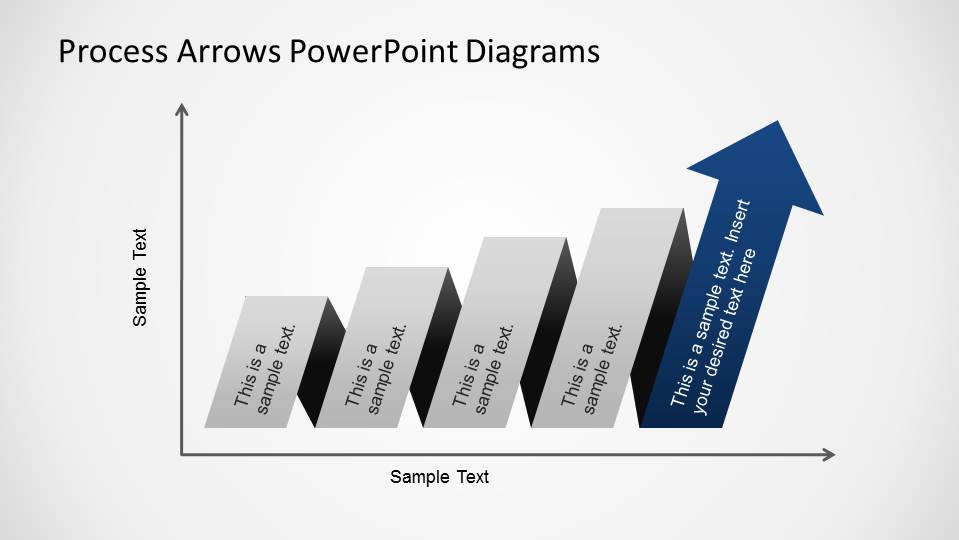
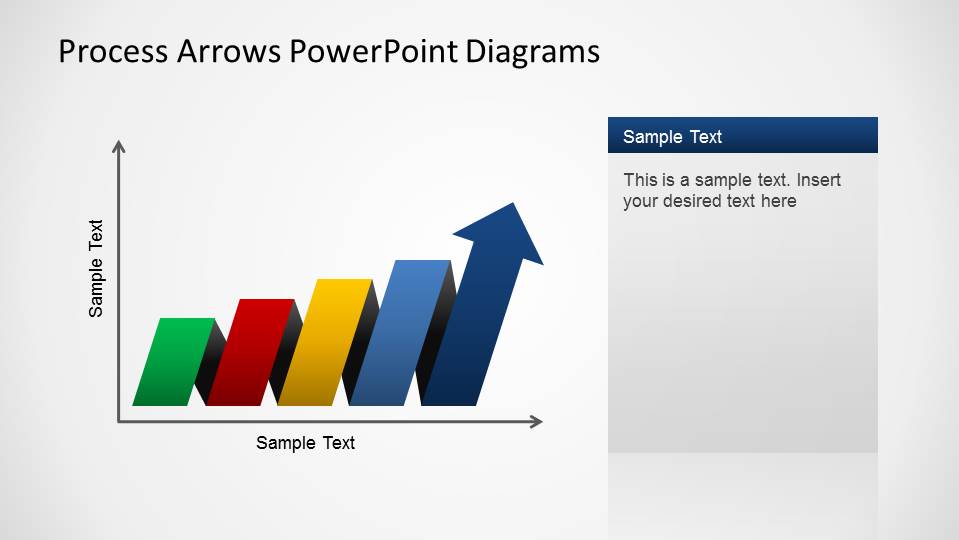
Another use of the process is to show increasing/decreasing tendencies for Business Presentations, Marketing Presentations or Financial Presentations, using the process arrows inside a Cartesian Axis.
What’s inside this template
Example presentation scenarios
- A marketing manager can explain funnel movement by using the increasing arrow process to show how prospects advance through staged actions.
- A project manager can report milestone progress by placing phases on the axis-based trend diagram and summarizing the current status in the text panel.
- A finance analyst can present rising or declining performance direction with the colored arrow blocks and axis labels to compare movement across periods.
- A consultant can map an operational improvement process with the legend-based arrow sequence so each step has a short label and supporting note.
Features
- 100% editable presentation template
- Compatible with Microsoft PowerPoint and Google Slides
- 16:9 aspect ratio slides
- Scalable vector shapes, icons and illustrations
- AI-Ready for Microsoft Copilot and Claude
- Instant access and download
Frequently asked questions
Q: How should a presenter turn the arrow steps into a clear process message?
A: Start by naming the overall movement in the title, then assign one idea per arrow block. Keep each vertical label short so the audience can read the sequence quickly. Use the bottom legend or right-side text panel for explanation, not long labels inside the arrows. This keeps the visual rhythm focused on progression.
Q: Who gets the most value from this process arrow template?
A: This template works best for presenters who need to explain staged movement rather than detailed operations. Marketing teams can show funnel progression, project managers can show milestone advancement, and analysts can show directional performance. The axis-based slides are especially useful when the message is about growth, reduction, or change over time.
Q: Why use arrow blocks instead of a standard numbered list?
A: The arrow metaphor makes direction visible before the audience reads the text. Rising blocks suggest progress, momentum, or increasing value, while the reversed layout can show reduction or movement back through stages. The axis slides add a measurement cue, helping viewers connect process steps with improvement or trend direction.


Process Arrows PowerPoint Diagram
5-slide presentation template with process arrows, funnel steps, and axis-based progress diagrams
Process Arrows PowerPoint Diagram is a 5-slide process diagram template for showing step growth, funnel movement, and progress direction. Visible layouts include increasing right arrows, decreasing left arrows, legend-based arrow sequences, and Cartesian axis trend diagrams. It is for business, marketing, project, and financial presenters using PowerPoint or Google Slides.
- Category
- Process Diagrams
- Rating


 Loading...
- Aspect ratio
- 16:9
- Item ID
- 6499-01
- Colors
 Microsoft PowerPoint
  Microsoft Copilot
  Claude for PowerPoint
 Other formats supported
Subscribe today and get immediate
access to download our PowerPoint templates.