Slide 1 of 3 from PEST Analysis Diagrams for PowerPoint
6118-02-pest-analysis-1
PEST Analysis Diagram for PowerPoint
- Diagram
- Matrix Quadrant
- Strategic Analysis Slide
- 16:9
- 100% Editable
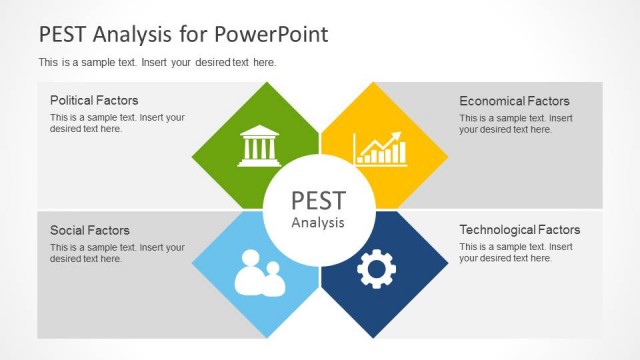
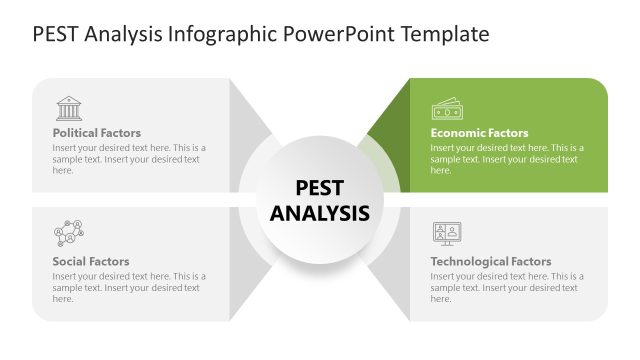
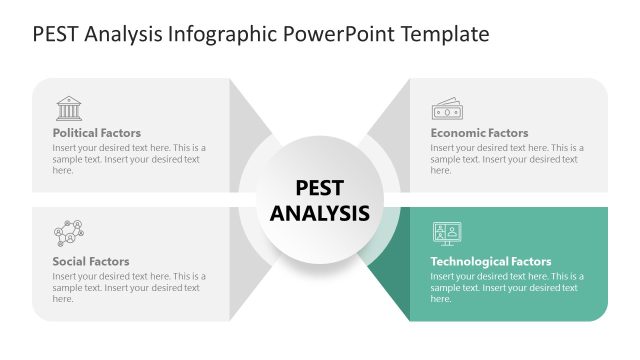
The PEST Analysis Diagram slide from the PEST Analysis Diagrams for PowerPoint template offers a clear matrix quadrant layout to present political, economic, social, and technological factors. This slide is designed for strategic planning and market analysis within business presentations, featuring editable shapes and a balanced color palette to enhance clarity. It integrates well into corporate presentation slide decks and pitch deck templates requiring a structured approach to external environment evaluation.
What’s on This Slide
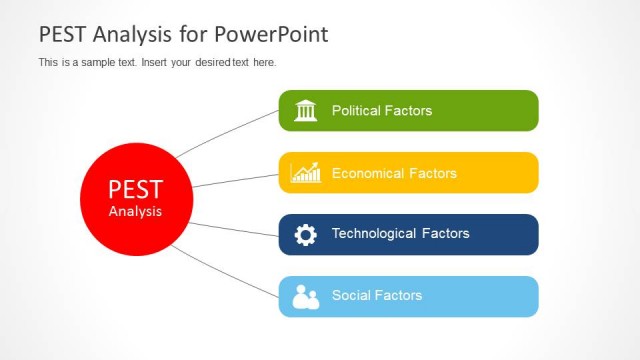
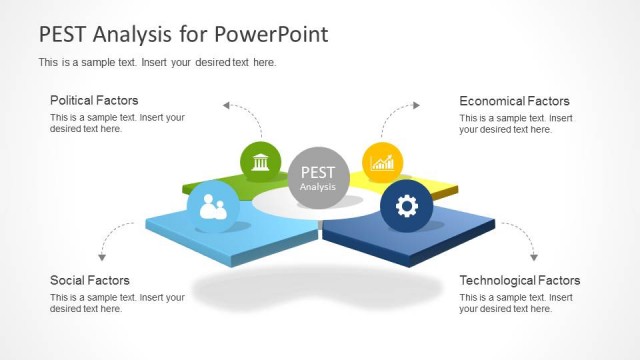
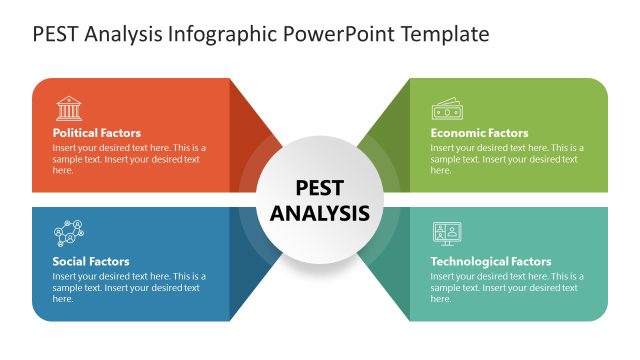
The slide features a central circular node labeled 'PEST Analysis' surrounded by four diamond-shaped nodes positioned at the top, bottom, left, and right. Each diamond contains a label: 'Political factors' at the top, 'Economic factors' at the right, 'Social factors' at the bottom, and 'Technological factors' at the left. Text placeholders are present in each node and the central circle, with the central node being the largest. The background is light, providing contrast to the colored nodes, which use a palette of blue, green, yellow, and orange.
How to Use It
This layout serves as a structured framework for presenting a PEST analysis, ideal for business contexts where external factors are evaluated. It fits well at the beginning of a presentation to introduce the analysis framework. Common scenarios include strategic planning sessions, market research presentations, or consulting reports where understanding political, economic, social, and technological influences is crucial.
Text Placeholders & Capacity
Keep your copy within these limits so it fits without resizing. Node labels can hold about 3-5 words each, while body text can accommodate 10-12 words.
| Placeholder | Count | Max characters (approx.) |
|---|---|---|
| Slide title | 1 | 40 |
| Item heading | 4 | 20 |
| Item body | 4 | 50 |
Slide Keywords
Download unlimited PowerPoint templates, charts and graphics for your presentations with our annual plan.
DOWNLOADReturn to PEST Analysis Diagrams for PowerPoint.