Slide 3 of 3 from PEST Analysis Diagrams for PowerPoint
6118-02-pest-analysis-3
PEST Analysis Diagram for Business Presentations
- Diagram
- Radial Hub
- Strategic Analysis Slide
- 16:9
- 100% Editable
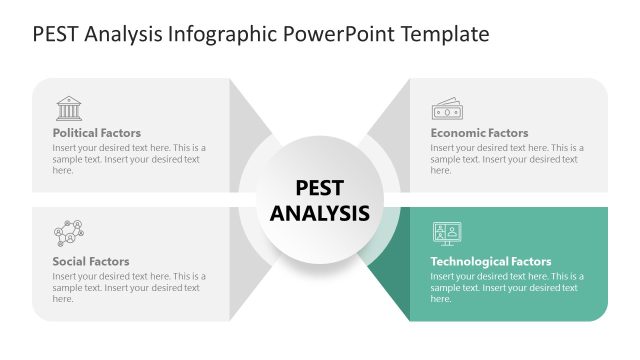
The PEST Analysis Diagram slide from the PEST Analysis Diagrams for PowerPoint template offers a radial layout ideal for business presentations focused on market analysis and strategic planning. This slide uses editable shapes and vector icons to clearly depict Political, Economical, Technological, and Social factors, making it a practical addition to any corporate presentation or pitch deck template requiring a structured environmental scanning overview.
What’s on This Slide
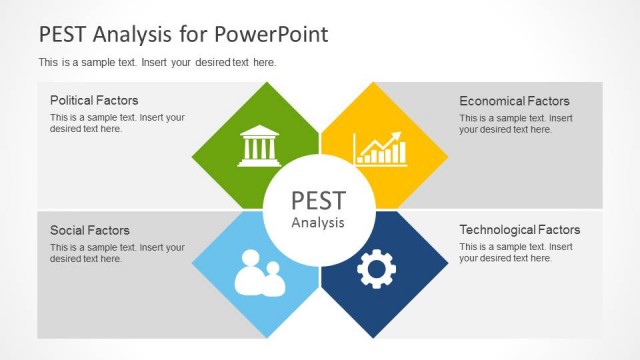
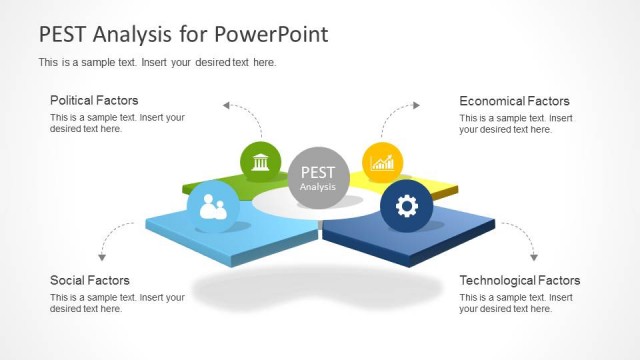
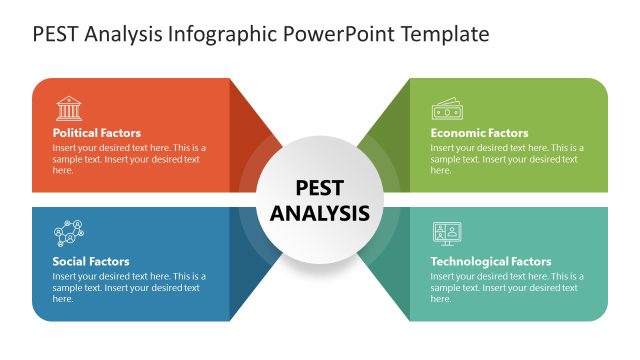
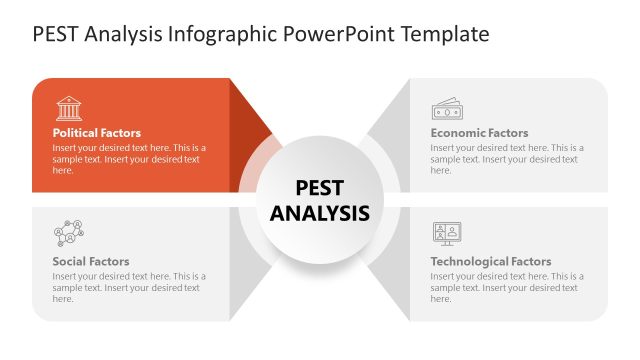
The slide features a central red circle labeled 'PEST Analysis' with connecting lines to four colored rectangles. The rectangles are positioned around the central circle, each representing a factor: Political Factors (green), Economical Factors (yellow), Technological Factors (blue), and Social Factors (light blue). The text placeholders are located at the top for the title and in the central circle. The overall layout is radial, with a clear visual hierarchy emphasizing the central concept. The background is white, providing contrast to the colored elements.
How to Use It
This layout serves as a visual representation of the PEST analysis framework, ideal for illustrating external factors affecting a business. It fits well in a presentation sequence after problem identification and before strategic recommendations. This structure is useful in business contexts such as market analysis, strategic planning, and environmental scanning, providing a clear overview of critical external influences.
Text Placeholders & Capacity
Keep your copy within these limits so it fits without resizing. Node labels can hold about 3-4 words each.
| Placeholder | Count | Max characters (approx.) |
|---|---|---|
| Slide title | 1 | 28 |
| Item heading | 4 | 20 |
| Item body | 1 | 40 |
Slide Keywords
Download unlimited PowerPoint templates, charts and graphics for your presentations with our annual plan.
DOWNLOADReturn to PEST Analysis Diagrams for PowerPoint.