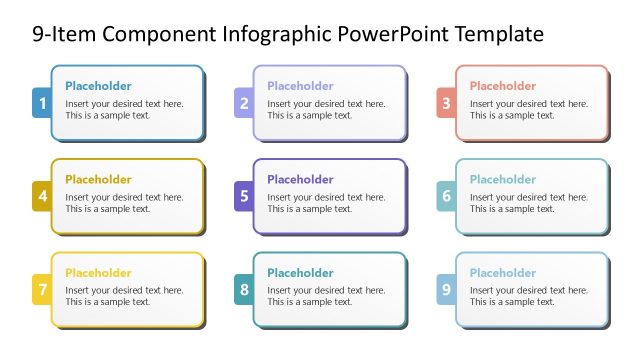
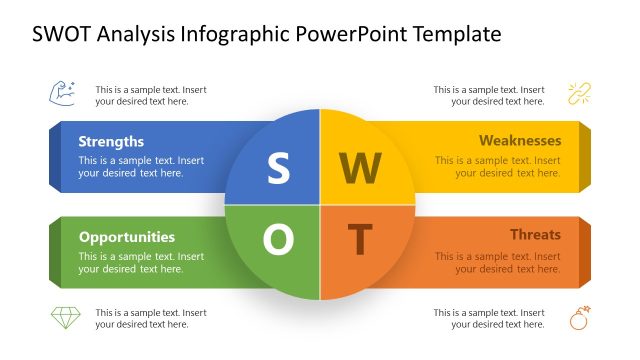
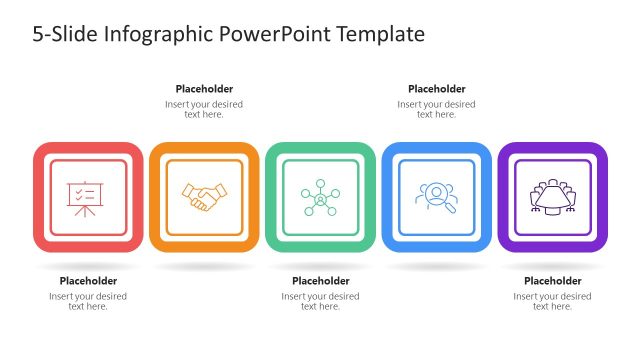
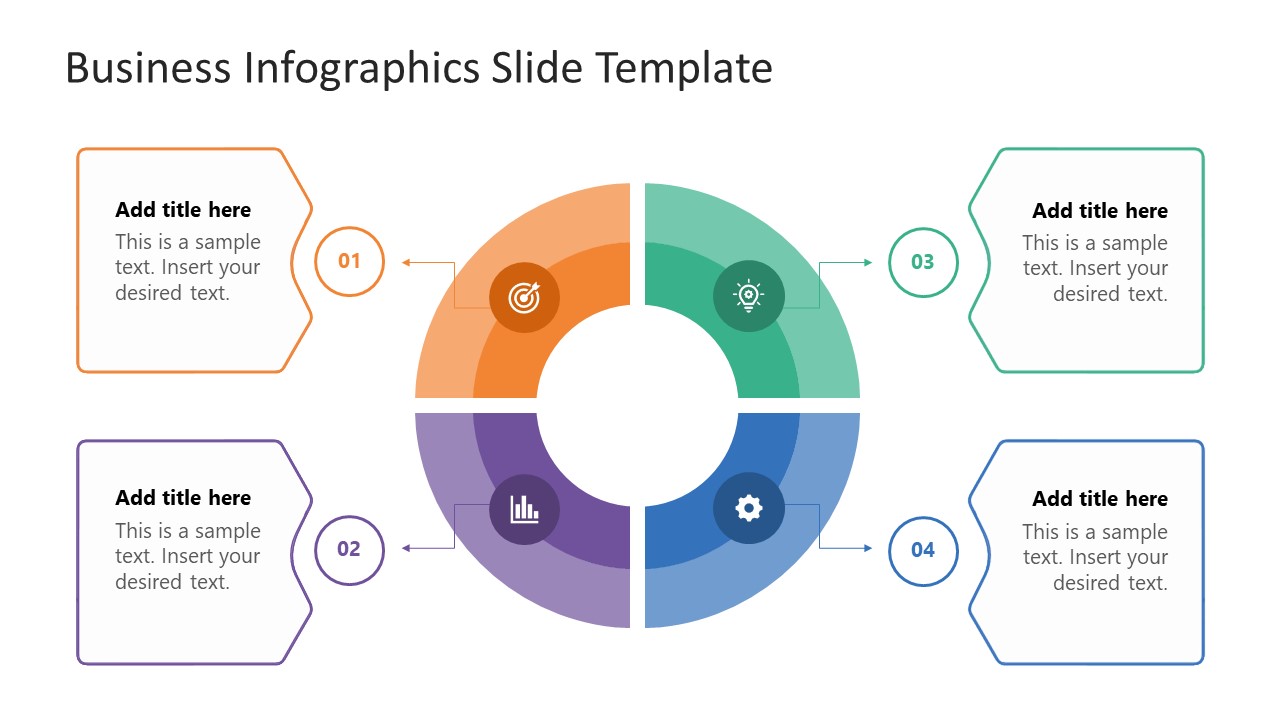
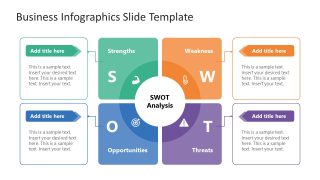
Present four components of a business model or project timeline using the Business Infographics PowerPoint Template. The infographics help business project managers share their ideas, opinions, and strategic next steps in a visually appealing format. For instance, a circular segmented diagram is ideal for clearly structuring the SWOT analysis outcomes. The SWOT analysis results let stakeholders understand the strengths, weaknesses, opportunities, and threats related to the company’s growth. The use of graphical icons helps the audience grasp the ideas and understand the model more effectively. This template features four distinct layout slides:
- A circular diagram with four sections and corresponding callout boxes with placeholder text to demonstrate key info. The use of numbers marks each stage separately.
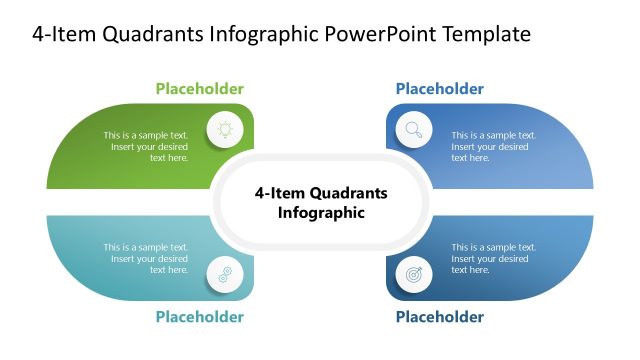
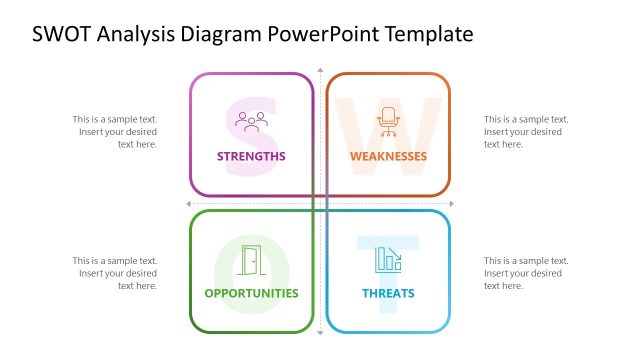
- The second slide features a square box with four sections and a circular disc at its center. This diagram is perfect for visualizing a four-point business model like SWOT, TOWS, DIKW, OSAR, etc. Business analysts use the text sections to share details briefly.
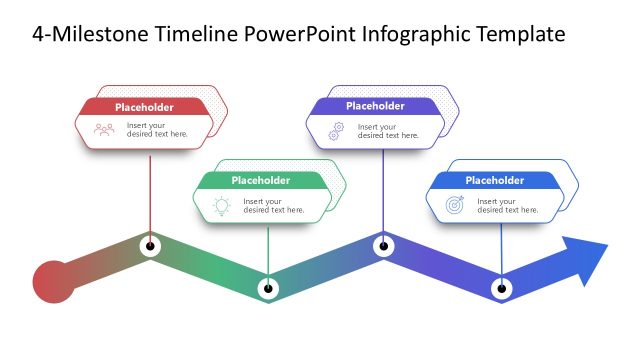
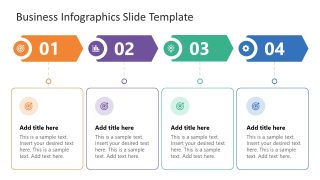
- The third slide is useful for project managers and product developers. They edit the four-step timeline diagram to track project progress and give an overview of the business roadmap.
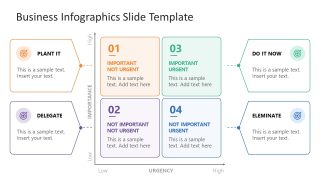
- The last slide is designed as an Eisenhower Matrix to prioritize tasks based on urgency and importance. It has four quadrant labels: “Plant It,” “Delegate,” “Do It Now,” and “Eliminate”.
The Business Infographics PowerPoint Template is customizable in Google Slides and other PowerPoint versions. Project managers use slide layouts in their project proposals, corporate decks, and investor pitches to communicate data clearly. Download the business information PPT template and use it in strategy presentations to discuss business frameworks.
What’s inside this template
Example presentation scenarios
- A project manager can use the four-step timeline slide to brief stakeholders on roadmap phases, milestones, and next actions in a short project update.
- A business analyst can use the SWOT analysis matrix to present strengths, weaknesses, opportunities, and threats during a strategic planning session.
- An operations lead can use the Eisenhower matrix to help a team separate urgent work from low-value tasks during a prioritization workshop.
- A consultant can use the circular four-part diagram to explain a business model, decision framework, or four-part recommendation to an executive audience.
Features
- 100% editable presentation template
- Compatible with Microsoft PowerPoint and Google Slides
- 16:9 aspect ratio slides
- Scalable vector shapes, icons and illustrations
- AI-Ready for Microsoft Copilot and Claude
- Instant access and download
Frequently asked questions
Q: How should I structure a short strategy message with this template?
A: Start with the circular four-part diagram to define the framework, then move to the SWOT slide if the audience needs evidence behind the recommendation. Use the timeline to show the sequence of action, and close with the Eisenhower matrix when decisions must be translated into task priorities.
Q: Who is this template best suited for in a business meeting?
A: This template fits presenters who need to explain a compact framework rather than a full report. Project managers, analysts, consultants, and team leads can use it when the discussion centers on four categories, roadmap steps, SWOT findings, or priority choices that need to be understood quickly.
Q: Why do the four-part diagrams work well for business concepts?
A: The repeated four-part structure gives the audience a stable mental model. Circular segments show balance among related categories, the SWOT matrix makes comparison direct, the timeline suggests progress, and the urgency-importance grid turns priorities into a clear decision map.


Business Infographics PowerPoint Template
4-slide business infographic presentation template with SWOT, timeline, and prioritization matrix layouts
The Business Infographics PowerPoint Template is a 4-slide infographic deck for structuring business concepts in Microsoft PowerPoint and Google Slides. It includes a circular four-part diagram, SWOT analysis matrix, four-step timeline, and Eisenhower priority matrix for project managers, business analysts, and strategy presenters.
- Category
- Diagrams
- Rating

 Loading...
- Aspect ratio
- 16:9
- Item ID
- 94229-02
- Colors
 Microsoft PowerPoint
  Microsoft Copilot
  Claude for PowerPoint
 Other formats supported
Subscribe today and get immediate
access to download our PowerPoint templates.